Blog: Amazon PPC Optimization: A Step by Step Guide to Find Converting Keywords
Amazon PPC Optimization: A Step by Step Guide to Find Converting Keywords
Amazon pay per click campaigns are some of the most cost-effective advertising platforms around. For the Jungle Stix product, we are getting some conversions for as little as a dollar a click. I would easily skip a trip to McDonald’s Dollar Menu if that dollar could be put towards selling a product!
When you create a purchase-focused marketplace like Amazon’s, it’s no surprise that a lot of random customer searches will lead to a sale. The question then becomes, which keywords convert well, and how much should we be willing to pay for them?
In this post, we will dig in to Amazon’s Search Terms report, and find keywords that are profitable for us.
Review of Jungle Stix Pay Per Click Campaigns So Far
You can read Greg’s post about creating Pay Per Click campaigns when he first launched Jungle Stix in December.
The strategy was basically to run two campaigns simultaneously: one campaign would be adding a bunch of relevant keywords that we got from Google’s Keyword Planner, and the other campaign would simply be Amazon’s automated campaign.
- Keyword Bids: were set at a maximum of $0.75 per click.
- Match Type: All of the keywords were set to Broad Match. So our ad would appear for searches like “bamboo sticks” could also
- Campaign Budget: Our Daily Budget is set at $100 per day.
Here is a look at the Campaign Manager Dashboard, from the day the campaigns started on 12/12/15 to today. You can see the Lifetime reports on the right:

And here is a look at each campaign, starting with the Manual Targeting:

And the Automatic Campaign:

The campaigns have pretty much been on auto pilot since then, and have been profitable.
The Average Cost of Sale is 16% and 17% respectively, which is pretty good, but there is still some room for improvement. Paid Search campaigns are all about optimization, so there are some tweaks that we can make to save money and convert more.

In this post, I will review how we can analyze the Search Term reports to find profitable search terms, and how we can reorganize our campaign structure to reduce our costs.
Step 1: Find the Relevant Data
Compared to Google’s well-polished AdWords platform, Amazon’s paid search platform is like the smart slacker: the data and intelligence is in there, it just takes some coaxing to get it out.
The first step to finding the converting keywords is to pull the Search Term Report. You can find that under the Advertising Reports tab of Seller Central:

Once you have your campaigns set up and running consistently, mark you calendar every 2 months to download this Search Term data. Unlike AdWords, which retains and displays all of your campaign performance history, Amazon only shows you the past 60 days. I guess it’s true, Bezos doesn’t like to share!
However, once you download the data, it renders in a text file, looking like this jumbled mess of mess text:

In this state, it is of little value to us. Let’s make some quick changes to make it more useful!
Step 2: Clean the Data
This step is pretty straightforward. Simply copy the text document, and paste it into your Excel spreadsheet.

On to the next one….
Step 3: Organize the Data
Alright, you’re still here! Now we’re approaching the fun part….the pivot tables! Pivot tables are a feature of Microsoft Excel and Google Drive that allow you to reorganize large data sets to be easier to read and understand. They can be very powerful, and also very easy to create.
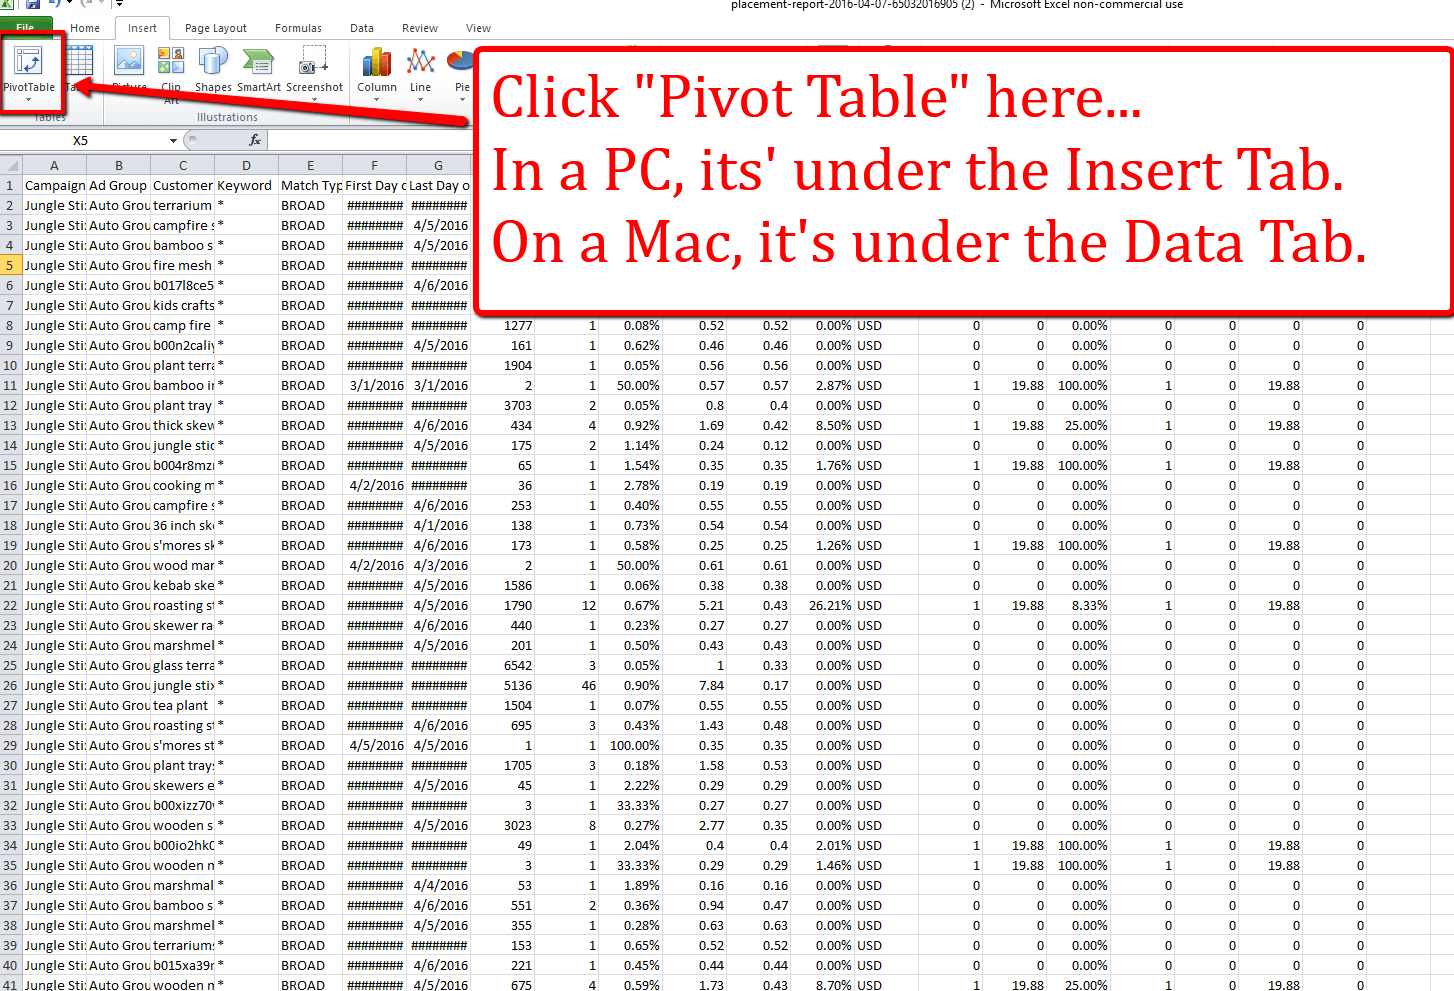
From your spreadsheet, you are simply going to click “PivotTable”:
It will automatically select the data that you have pasted, and you can paste it onto a New Worksheet. So without changing anything, you can just click “OK”:

You should be brought to a blank sheet: endless possibilities, but can be confusing where to start.

As you can see in the top right, the columns from the Search Term Report are listed as fields. These are the fields that I select in my Pivot Table:

Note: I choose not to include any calculated averages, like click through rate, average cost per click, Average Cost of Sales. It is better, and more accurate, to calculate these manually. We'll review how to do this later.
Once you select the fields to add to the report, you will need to organize them. This is how I organized the fields for this pivot table (it’s as easy as drag-and-drop between the fields):

And after you click OK, your Pivot Table will look like this:

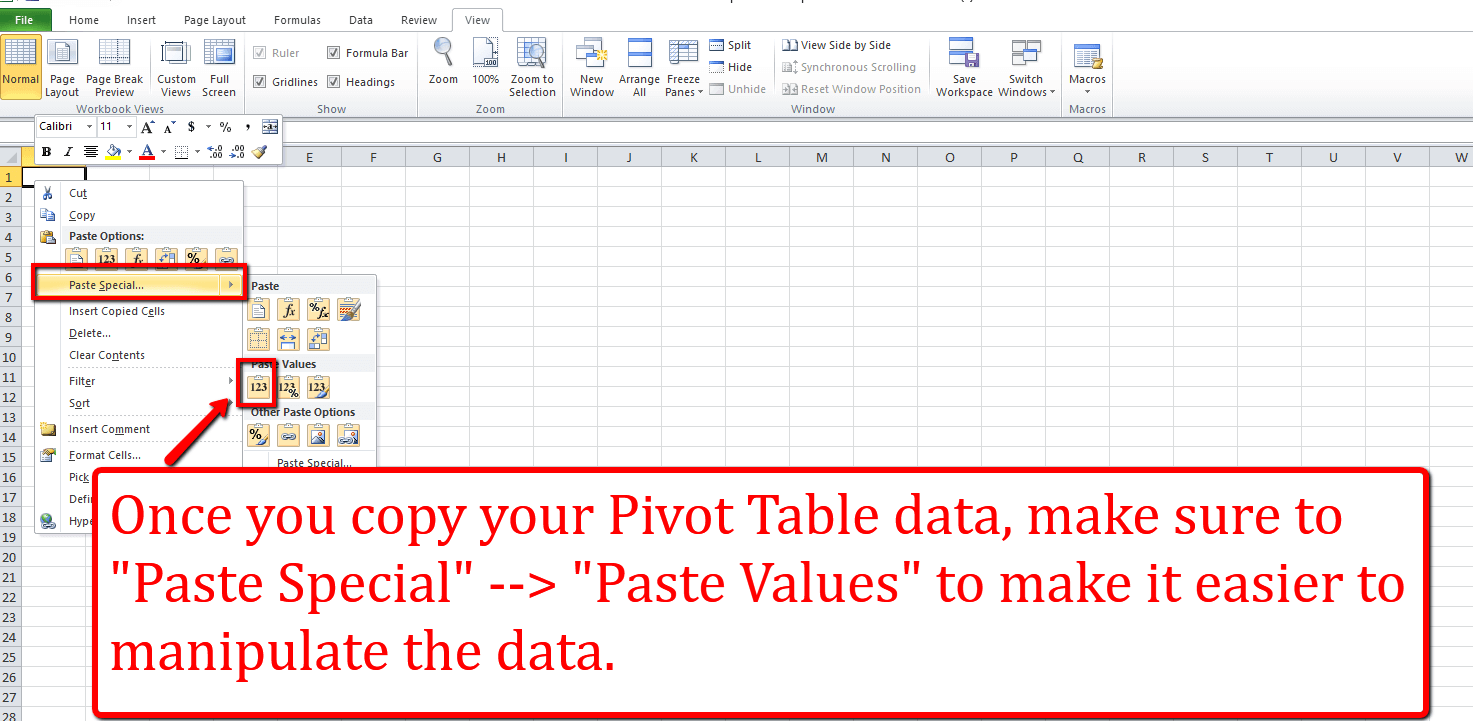
Once I am here, I copy the whole sheet, and paste it to another brand new sheet. However, when pasting, make sure to “Paste Special” and “Paste Values”, so we don’t have to deal with the formatting of the Pivot Table.
At this point, let’s add in some additional columns for helpful metrics that we can calculate.
Pivot Tables are the easiest and most powerful way to make sense of #Amazon #PPC data. Click To Tweet
This includes the following:
- Click Through Rate = Clicks / Impressions. Helpful to know how many customers were interested in your ad and clicked it. If it is low, then it may be an unrelated keyword, or the image/headline isn't engaging enough to click through.
- Average Cost Per Click = Total Cost / Clicks. Helpful to know how much, on average, you are paying for a click to your product page. You want to manage your average cost per click, and bids, depending on how much it costs you for each conversion.
- Conversion Rate = Conversions / Clicks. Helpful to measure the relevancy of the keyword, based on how many people who land on your page actually purchase your product.
- Cost Per Acquisition = Total Cost / Conversions. Helpful to know whether you are making or losing money for a given pay per click conversion.
Additionally, I like to filter the column headers so that we can easily sort the data depending on which metric we are looking at. This is how you filter the data:

Lastly, you can make it cleaner visually by adding the appropriate number type for each column, whether dollars, percentages, or integers. So now that things are organized, let’s dig in and find see which keywords are converting well for us.
Step 4: Analyze the Data
If you have made it this far, kudos to you! To make it more interesting and engaging to you, and so we’re on the same page, you can download the worksheet that we have put together with the actual Search Term data for 2/19/16-4/18/16.DOWNLOAD THE WORKSHEET HERE!
Here are a few steps that can help us get more mileage from the keywords that convert well, and those that are bringing unqualified traffic that doesn’t convert.
One quick yet important side-note: how much are we willing to pay for a new customer? Here is how we will piece that together.
- Retail Price: $20
- Cost of Goods Sold (Including all shipping): $6
- Amazon Fees: $9
- Net Margin = $20 – $6 – $9 = $5
Theoretically we could spend up to $5 on marketing and still break even. That is assuming that the selling price stays at the current $20 price point. Good to know! Amazon’s Pay Per Click terminology would calculate that as an Average Cost of Sale à $5 / $20 or 25% ACoS.
So our break even Cost per Acquisition is about $5, or said differently, we can shoot for a maximum ACoS of roughly 25%. We won’t outright pause any keywords that are above these thresholds though, because there are some additional benefits to getting customers, like a boost in organic ranking, an increase in reviews, and a lift in organic conversions as a result of more reviews.
Pay Per Click Optimizations
Alright, now it’s time to start optimizing the campaign!
Step 1: Adjust Bids and Pause Keywords
As I mentioned earlier, our Jungle Stix campaigns were both Broad Match campaigns. So we left the targeting completely up to Amazon’s algorithms for which search queries our ad would appear for. The benefit of this is that we would come across some good keywords that we didn’t expect. The negative could be that we end up paying for a lot of irrelevant clicks that don’t turn into customers.
To filter for these keywords that aren’t working, I like to first filter for the keywords that are costing the most money. Are there some search terms there that are completely out of left field that are irrelevant yet generating clicks and costing ad spend? A quick scan through the list, and I don’t see any.

I would then want to scan over to Column J, Cost Per Acquisition. Are there some keywords that are very expensive? It looks like “marshmallow sticks” has had two conversions, at $18.55 per sale. That is eating into our profit margin like a rabid monkey. No thank you.
So we have a few options here:
- We can reduce our maximum Cost Per Click bid, which is currently $0.75. At $17 per conversion, we are basically at 3x our Cost Per Acquisition threshold of $5. So if we reduce our max bid by 3x, we would theoretically be getting conversions at $5 and breaking even. That would mean that our maximum bid would be $0.25.
- We can pause the keyword altogether. We have only generated 2 sales with this keyword over the past 60 days, so we probably wouldn’t see a noticeable dip in overall sales if our ads don’t show for this keyword. And we would not be losing money on each sale.
- We can keep it running as is. This is the aggressive play for the seller who wants a sale at all costs. In some ways, selling on Amazon is a land-grab of sorts, so there is a rationale to this.
You can choose whichever path is most comfortable for you, but those are the thought processes when looking for the poorly converting keywords.
On the flip side, there are some keywords that are your money makers. These are the keywords that have brought paying customers and profits. So you want to make sure that you are showing prominently for these search queries.
Keeping the same filter, of seeing the search terms that you have spent the most for, I see “wooden skewers” has generated 10 sales, at $1.44 per sale:

So make note of that, and you’d want to increase the max bid on that keyword. The average Cost Per Click is only $0.37, and our max bid is currently at $1.00, so increasing it won’t really do much, but if competition emerges for this keyword, at least you will continue to win the bids.
Here are some other helpful filters to check out
You can also sort by the Conversions column, from highest to lowest. This will help you pull out the converting keywords, and make sure that your bids are high enough.
You will also want to check the converting keywords, and check your Max Cost Per Click bids against your Average Cost Per Click.

The basic concept is that you want to make sure that your average cost per clicks aren’t close to your max bid for any good keywords. If it is, then that means that you may be losing out on impressions due to a low bid, and if the keyword converts, then you may be missing out on sales. Filtering from Largest to Smallest, it looks like our highest average CPC is $0.75, and our bids are at $0.75, so if it is a good keyword for us, then we may want to adjust the bid.
You adjust the bids for each keyword (in manual campaigns) in each Ad Group, like so:

Step 2: Narrow The Keyword Targeting (change from Broad match to exact match)
One adjustment that we can make to reduce our spend is by reducing the number of Broad Match keywords and create a new campaign for Exact Match or Phrase Match keywords that are converting well.
For example, for our Broad Match keyword “bamboo sticks”, we are matching to all of these customer searches.

If we change this to Exact Match or Phrase match, we would have our ads only show for “bamboo sticks” for exact match, or a phrase containing “bamboo sticks” in that order, like “9 inc bamboo sticks” or “bamboo sticks 100”. You will have much more control, and specific targeting with Exact Match, which means that you can separate out the non-converting keywords and save some money.
This would help us reduce our spend, assuming that we follow through on the next step.
Step 3: Create New “Match Type” Campaigns
In order to help organize your pay per click campaign structure, it is helpful to separate your match types into different campaigns. Some people like to separate into different ad groups, but I think you can control your budgets more easily if they are in separate campaigns.
Create a new campaign, which you can call, “Jungle Stix Exact Match” and add all the keywords that you identified as good converting search terms. After you do this, you will have two campaigns, one for broad match and one for exact match. Now you are starting to really tighten up your pay per click campaigns. Just one more step for the fully polished campaigns.
Use Match Type to ensure you are only paying for qualified traffic. #growth #savedat$$$ Click To Tweet
Step 4: Check For Keyword Cannibalization
This next step is a Google Ad Words best practice, I have not yet verified if it makes a difference in Amazon’s platform though. It is having your keywords competing against each other, and increasing the price you pay for a click. If for example, we have “bamboo sticks” in two different campaigns, they are essentially increasing the necessary bid to win an ad auction.
Here’s what you do…
Take all of the Exact Match or Phrase Match keywords from the new campaign that you created. And add them in as “Negative” keywords in your Broad Match campaign. You would do that here:

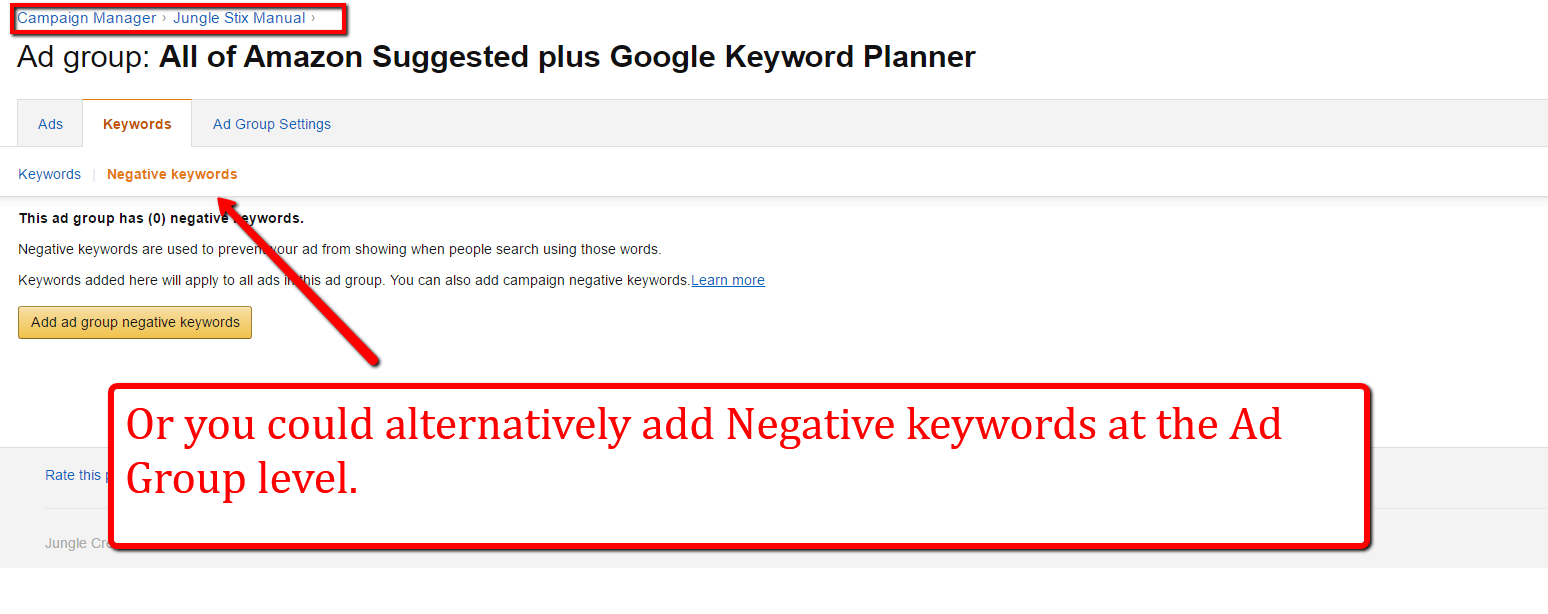
Or if you prefer to separate your keywords by Ad Group, you can add Negative Keywords at the Ad Group level:
Now you will still be getting your broad match keywords for “bamboo sticks” searches, like “110 bamboo sticks” for example, but if the customer searches for “bamboo sticks” and you have created an Exact Match campaign that includes that search term, then your ad will appear. This is helpful because you now have much more control over the search terms that you appear for, and the price you pay for a click.
In Conclusion
Thank you, friend, you have made it to the end! Hopefully now you have a grasp of how to pull helpful search term data from Amazon, reorganize it, and pull insights from it to save you money and generate more sales. This was a long post, and there may be some details that you have questions about, so please drop them in the comments section so I can clarify anything. And if you have other suggested pay per click tips that you can share, please do! I will cover other PPC related posts in the near future.