Blog: Amazon Sales Estimate Case Study UPDATE
Amazon Sales Estimate Case Study UPDATE
Back in the summer of 2018, we put the Jungle Scout tools to the test with the ultimate Amazon sales estimate accuracy case study. Instead of just claiming to be the most accurate tool in the industry, we wanted to prove it.
So we asked sellers for their permission to access their products’ actual Amazon sales data. We contracted a third party to collect estimates for the aforementioned items, using a selection of our competitors’ tools. And we documented every step of the study, then publicly released the results.
2019 Update
Since the initial case study, our data science team has worked tirelessly to not only maintain the level of accuracy reported in the original results, but to improve upon them.
Given the complexity and ever-changing nature of Amazon’s algorithms and marketplace rules though, estimating their sales is a full-time job. But it’s always our mission to stay ahead of the game!
Keeping the best interests of the Amazon FBA community in mind, we included a few more competitor tools in this new analysis. For the rest of the study, we used the exact same steps we used in 2018 when collecting this year’s data.
And so the question remained – Is Jungle Scout still the most accurate when it comes to estimating the number of sales on an Amazon listing?
The analysis & results
Our first calculation was to determine the median difference in estimated sales relative to actual sales. The formula looked like this:
((Absolute (Actual Sales – Estimated Sales)/Actual Sales).
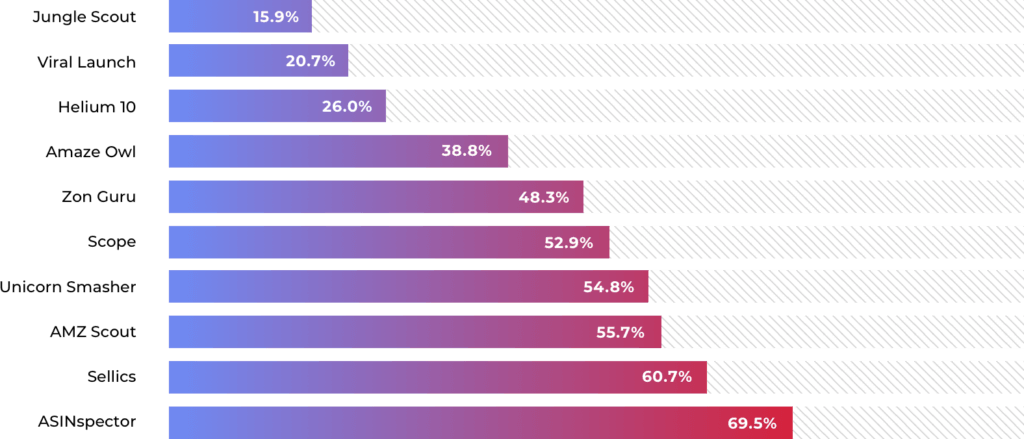
Then we took the median of those percentage errors for each of the tools–which we’re calling the Overall Error Percentage–and compared them. The closer to zero the better!
Our reaction:
- The most noteworthy result from this study is that Jungle Scout’s accuracy has improved by nearly 10%! Last year we were looking at an Overall Error Percentage of 25.41%. Today we can see that Overall Error Percentage has dropped to 15.9%, as we continue to close the gap on Amazon’s actual sales reporting.
- If you compare our two case studies, you’ll notice that Viral Launch and Helium 10 (the second and third place tools) improved their Overall Error Percentage as well. Jungle Scout’s rate of accuracy is still the best, and the only software with an error percentage lower than 20%. We’re confident that conducting regular case studies would continue to prove that point.
- While Helium 10 has the third best median, you’ll see in the results below that its range of accuracy is significantly worse than the top two performers: Jungle Scout and Viral Launch.
- Unicorn Smasher stepped up their game with a paid version of their extension, which appears to dramatically improve their estimation abilities. We take back our comment about rolling the dice rather than using their extension!
- We’re unable to compare an increase or decrease in accuracy for AMZ Scout and Sellics, who were absent from the previous study. But as they both sit over the 50% error mark, it would be difficult to trust the validity of their sales estimates.
A better way to determine accuracy
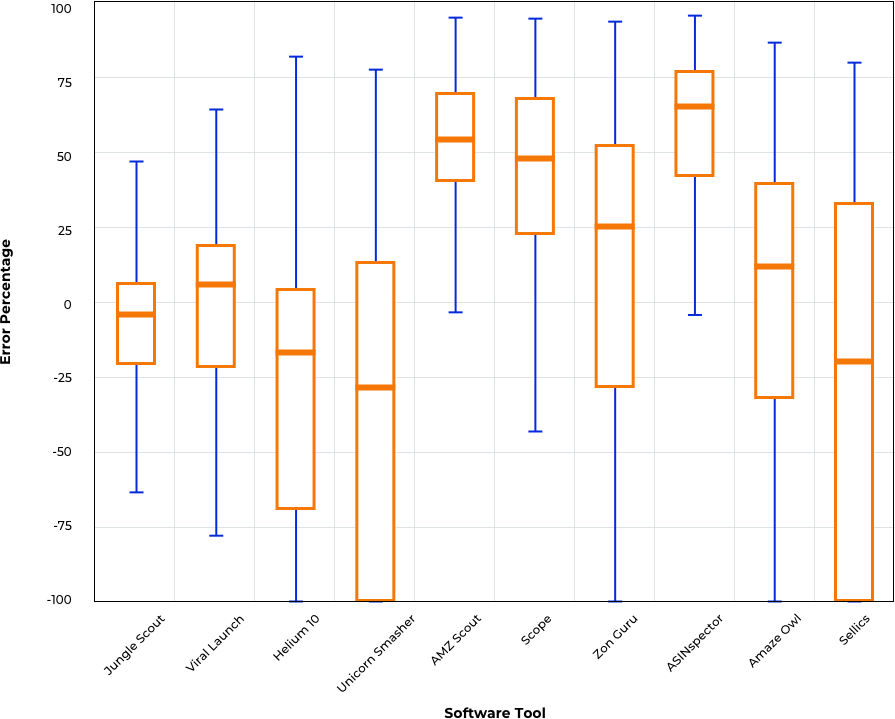
When choosing a singular number that is the most robust for comparing accuracy, the median overall error percentage is a great choice. That being said, a box and whisker plot is actually a better representation of the true accuracy of each tool in our study, for any given sales estimate.
An Amazon seller typically wants to know that when they are reading a sales estimate for a product, it’s as close to the real sales number as possible. One hundred percent accuracy is what we all want! Creating and interpreting a box and whisker plot lets us do this.
Here are a few tips to help you read this chart:
- The orange line represents the median and should be as close to zero as possible.
- The height of the box shows the “inter-quartile range”, which is a fancy way of saying the middle 50% of the results. The smaller the box, the greater the accuracy.
- The T-shaped lines or “whiskers” show the lower 25% and upper 25% of the results. Again, the smaller the whiskers, the more accurate the tool is.
Our reaction:
-
Based on the box and whisker plots, I would rank the accuracy of the tools as followed:
-
- Jungle Scout
- Viral Launch
- AmazeOwl
- Helium 10 & ZonGuru (tie)
- Scope
- AMZ Scout
- ASINspector
- Sellics
- Unicorn Smasher
-
- Similar to the results of the median, Jungle Scout is the most accurate and Viral Launch is in second place.
- By gauging purely off the median, Helium 10 looks pretty close to Jungle Scout and Viral Launch. However, you see its box and whiskers are significantly larger. This means that in any single estimate, Helium 10 is more likely to be significantly incorrect, especially with underestimating sales. On that same token, if you run Helium 10 on thousands of products and averaged all of them, it would only be a little worse than the top two performers. The latter scenario isn’t realistic for typical use cases, so is probably a moot point.
- I would prefer to use AmazeOwl over Helium 10 or ZonGuru since its box is better straddling the 0% line. However, it’s only by a hair.
- If you use AMZ Scout, Scope, or ASINspector, the vast majority of estimates are going to be significantly overinflated. These tools are consistently overestimating, as shown by a relatively small box. I recommend reducing all of the estimates produced by those tools by 40-60%.
- Sellics isn’t known as a product research tool, so it’s unlikely they invest any real time or resources in improving their sales estimates. Our test certainly seems to bear that out!
- Unicorn Smasher continues to provide very poor sales estimates, even with the paid version of their extension.
Our interpretation of the overall results:
It was really interesting to look through this new round of data and see that the results basically flipped from the last case study. The majority of the competitor tools actually swayed toward overestimating sales this time.
- Between the two case studies, it was interesting to see which tools started to invest in their accuracy. Amaze Owl now has a Market Analysis feature in beta testing that’s rapidly increased their accuracy. And the paid version of Unicorn Smasher proved to be more accurate than their free version.
- Surprisingly, the majority of our competitors have an Overall Error Percentage over 50%. Is that level of accuracy worth investing in with your money or your time?
-
Jungle Scout and Viral Launch, in our opinion, continue to stand out as the only two tools that have reliable sales estimates.
- But from a relativity standpoint, Jungle Scout is still 24% more accurate than Viral Launch, based on the median values. And the box and whisker plot shows a similar relative accuracy: roughly 24% better.
What really matters?
Numbers and charts aside, our priority will always be to help our customers make informed decisions. It is the driving force behind the continuous improvements to our software, our data, and the resources we provide.
But sales estimates will never be the deciding factor in whether or not an FBA business will succeed or fail. The business is too complicated to hinge solely on the accuracy of a product’s sales estimates.
However, a seller’s journey has to start somewhere, and it usually starts with product research. And in-depth research, with accurate data, is the best way to begin. We’re just trying to start you on the right foot!
TL:DR – Jungle Scout’s software is the most accurate. Our error percentage was nine points better than our closest competitor’s (but there’s a lot to that first study, so we still encourage you to read it).
Raw Data
Interested in running your own analysis? You can access the raw data collection in this spreadsheet.
Interested in watching 24+ hours of data-collecting video recordings? Enjoy these videos.