Blog: How to Calculate Your Amazon Profits with Seller Central
How to Calculate Your Amazon Profits with Seller Central
What is the most exciting part about being an Amazon seller? Getting sales, of course! Prior to those first sales, the Amazon seller road is paved with apprehension and self-doubt. Newbies toil over the same questions…
- What if my boxes are not labeled properly and Amazon rejects the shipment?
- What if my product does not sell?
- What if my first reviews are negative?
- What if someone hijacks my listing?
But, the mindset shifts after the first organic sales start to trickle in. I remember the relief and elation I felt when I got my first automated shipment notification from Amazon saying that my product was shipped to San Antonio, TX.

That was the moment that I finally believed I could be successful selling on Amazon. It was a great milestone, but the journey to becoming a profitable Amazon seller had just begun. We in the Amazon circles need to talk more about what it takes, and what it means to be a profitable Amazon seller.
Over the past nine months, I have been working with the Jungle Scout team to build Fetcher, a profit analytics tool for Amazon sellers. I have had the chance to talk with hundreds of Amazon sellers about their biggest challenges.
80% of the Amazon sellers I talk to are really struggling with bookkeeping and accounting practices.
Very few sellers have a watertight system in place to calculate and monitor performance metrics. Tools like the Profit & Loss Statements, Balance Sheets, or Cash Flow Statements are critical for monitoring profitability, and they are being forgotten about in an industry where sales are sexier than profits. I suspect that…
Most Amazon sellers do not really know their profits!
Shocked? Not me. I was in the same boat. I struggled to evaluate my own profitability as an Amazon seller during my first six months in the game. But eventually, I learned that if I did not change my practices and priorities, my business would fail.
So, what should be the most exciting part about being an Amazon seller? Having the confidence to say with certainty for the first time “my business is profitable!”
“It is a capital mistake to theorize before one has data.” Sir Arthur Conan Doyle.

We will study all of the pertinent data from Amazon's most recent reporting period that lasted from September 15th – September 29th. All of the data we are going to analyze comes from one of my actual lighting products that I sell using FBA.
Sales Performance Metrics
I gave Sales a hard time earlier, but it is true that Sales are the lifeblood of any retail business. Seller Central tracks and displays sales in various formats. The challenge is weeding through the mess of data to find the relevant stories. For sales analysis, I recommend starting with a high-level view and going progressively deeper into the details.
Analysis Level 1
Start with the Amazon Sales Dashboard to get a quick snapshot of your sales performance.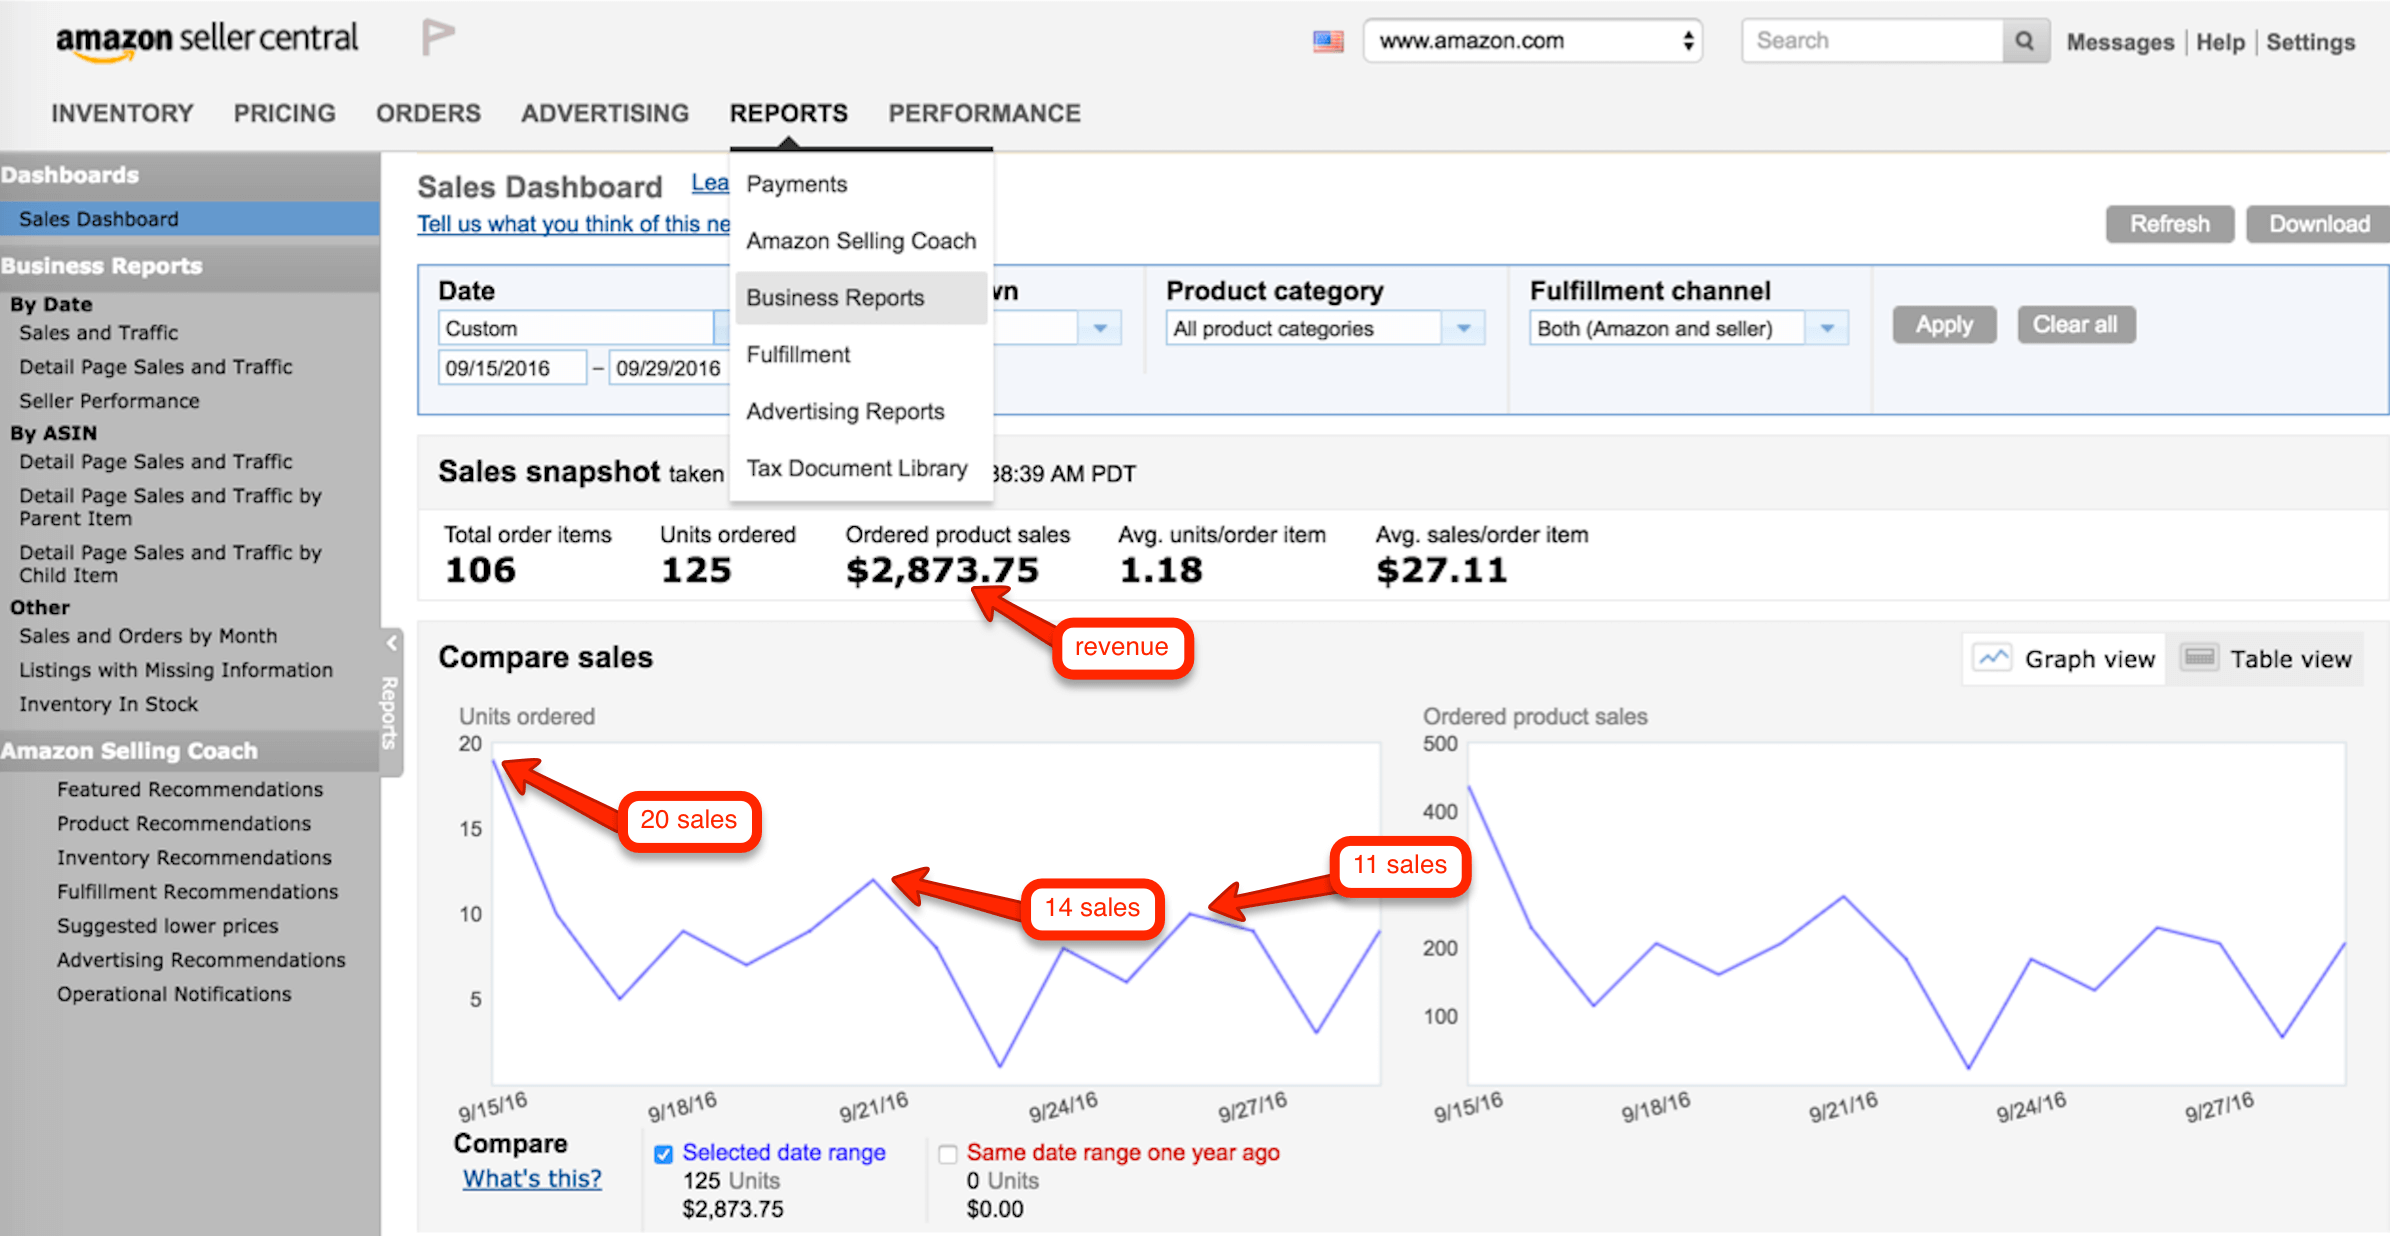
The most noticeable piece of information is Ordered Product Sales. This lighting product generated about $2,900 in revenue over the reporting period. Great, but what does that really mean for me? Not much.
Next, take a look at the sales trend line. My first observation here is that this product appears to sell best in the early part of the week. I was curious enough to test this observation over a wider date range, and I confirmed that sales and conversions for this product are almost 15% higher between Monday and Wednesday than during the weekend period. Now that is actual data we can work with!
A quick analysis of the data suggests that shoppers are more inclined to search for, and purchase this product during the beginning of the work week. This is a simple example of analyzed data that can drive effective tactical business decisions.
I am going to test the data analysis by increasing Pay Per Click spending by 10% on Monday, Tuesday, and Wednesday. I will evaluate the results in three weeks and see if my marketing campaigns continue to convert at a higher rate during the start of the week. Naturally, that will also mean an increase in sales 🙂
Analysis Level 2
After a quick look at the Sales Dashboard, I like to move onto the payments report to get a better idea of how my Amazon expenses are affecting revenue, and ultimately, my profits. Here is my most recent payment statement for the lighting product.
Orders
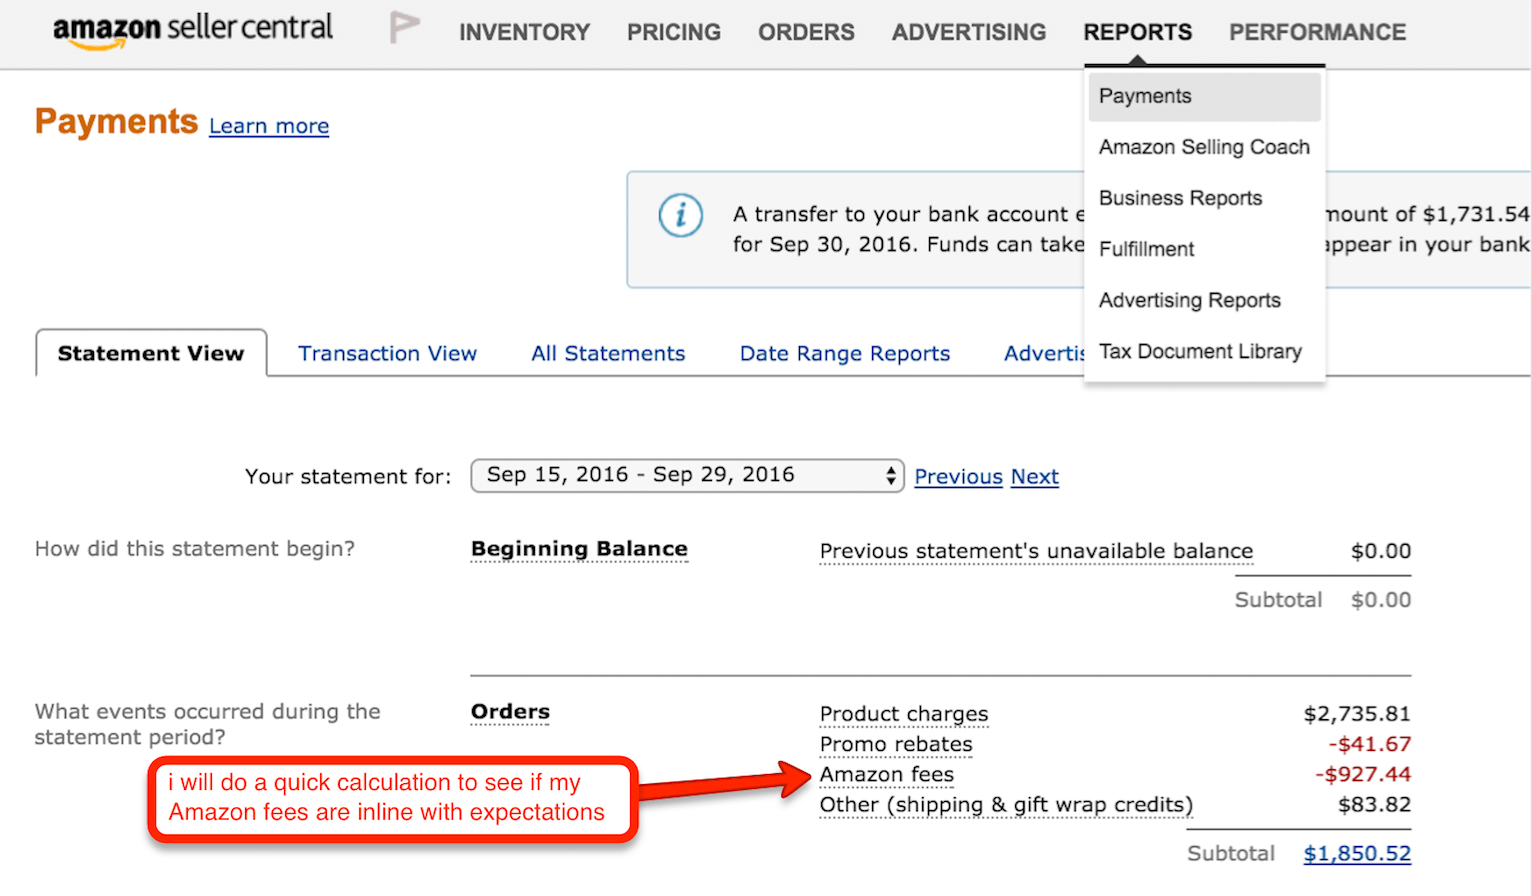
I always run a quick cross-check on Amazon fees to ensure everything is in line with my expectations. For this product, I set a performance target to keep Amazon fees under 40% of total revenue.
Revenue = $2,735.81
Amazon Fees = $927.44
Amazon Fees / Revenue = 0.34
Amazon Fees = 34% of Revenue. Check!
The Waterline Technique
Think of this target as a waterline to observe. As long as Amazon fees stay under 40% of total revenue, the alarm will not go off, and no action is required. But if the waterline is exceeded, an investigation ensues and a business decision is required.
Let's pretend that Amazon fees had been 42% of total revenue, and the alarm had sounded. In this case, I would either adjust my target or take the necessary action to get back on track. Raising prices or lowering PPC spending could be quick solutions. But those actions can have a butterfly effect.
Why not try to lower Amazon fees? Yes, it is possible to control Amazon fees. Manipulating FBA fees to your advantage is a baller move. It will require an advanced understanding of how FBA fees work and how they relate to your inventory turns. This guide to FBA fees can help get you to baller status.
Refunds

Use the refunds section to quickly calculate return rates. The waterline technique is critically important in managing refunds. Why?
Refunds rant
Most Amazon seller can not afford to spend their time investigating every single refund. Our time is better spent growing our businesses. Refunds are a massive part of the game because Amazon is built on a foundation of almost limitless customer service.
In my opinion, Amazon is a customer-driven platform. Not a seller-driven platform. Think about it, Amazon will allow a customer to purchase my lighting product and nine very similar products in one transaction. The customer can install all ten products and evaluate them for three weeks before selecting one product to keep and returning the other nine.
I do not think this is any reason to get discouraged, but it does mean that sellers need to come to grips with higher return rates than in typical retail markets. Rant over 🙂
For this lighting product, I set a quality target of 6%. Meaning, the refund rate in dollars should be 6% or less of total revenue.
Revenue = $2,735.81
Refunds = $132.56
Refunds / Revenue = 0.048
Refunds = 5% of Revenue. Check!
Some Amazon sellers prefer to calculate their refund rate in terms of total units refunded versus units sold. That view is easily available by going to Reports >> Business Reports >> Sales and Traffic and then filtering the pivot table with the right-hand column.
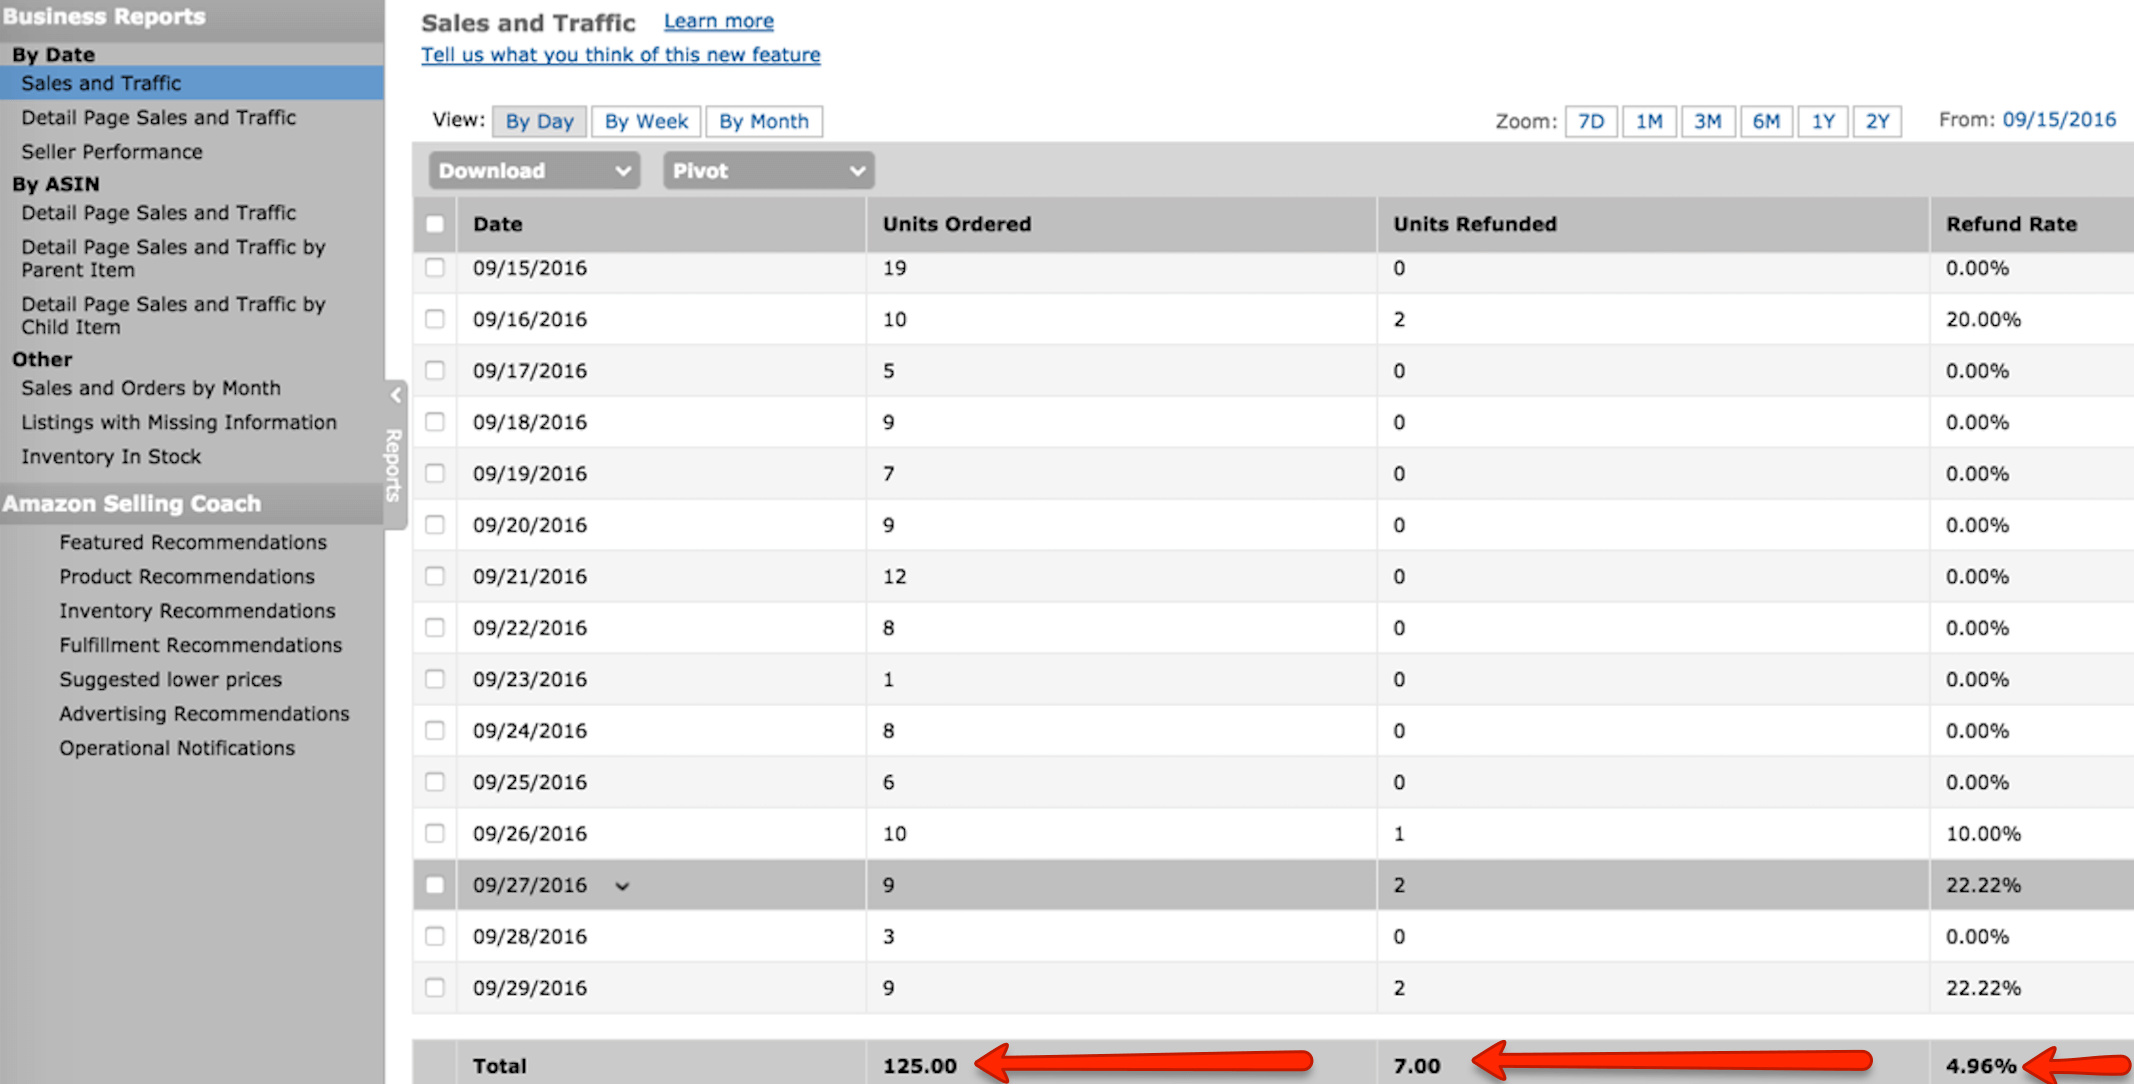
Personally, I care more about the financial impact from refunds, which is why I calculate refunded dollars against total revenue. Also, Amazon credits some refund fees back to the seller, which would not be captured doing a units-based refund calculation like the one above in the Sales and Traffic pivot.
Closing Balance
Lastly, confirm the Closing Balance is exactly what is in your bank statement.
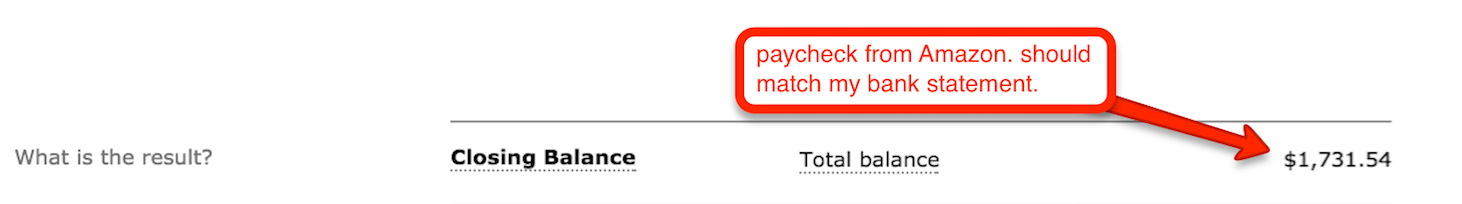
Everything appears to be in good shape with this product. All high-level targets were met. This is the bi-weekly financial analysis I do every time Amazon closes a reporting period and issues a payment statement.
Analysis Level 3
The next level of analysis goes much deeper. To get there, we will need to adventure into the raw data reports. There are three primary data reports that I use.
- Payments Report
This is the line-by-line raw report that generates the bi-weekly Payment Statement we just analyzed. Many Amazon sellers are unaware of this report. Here is how you find it…
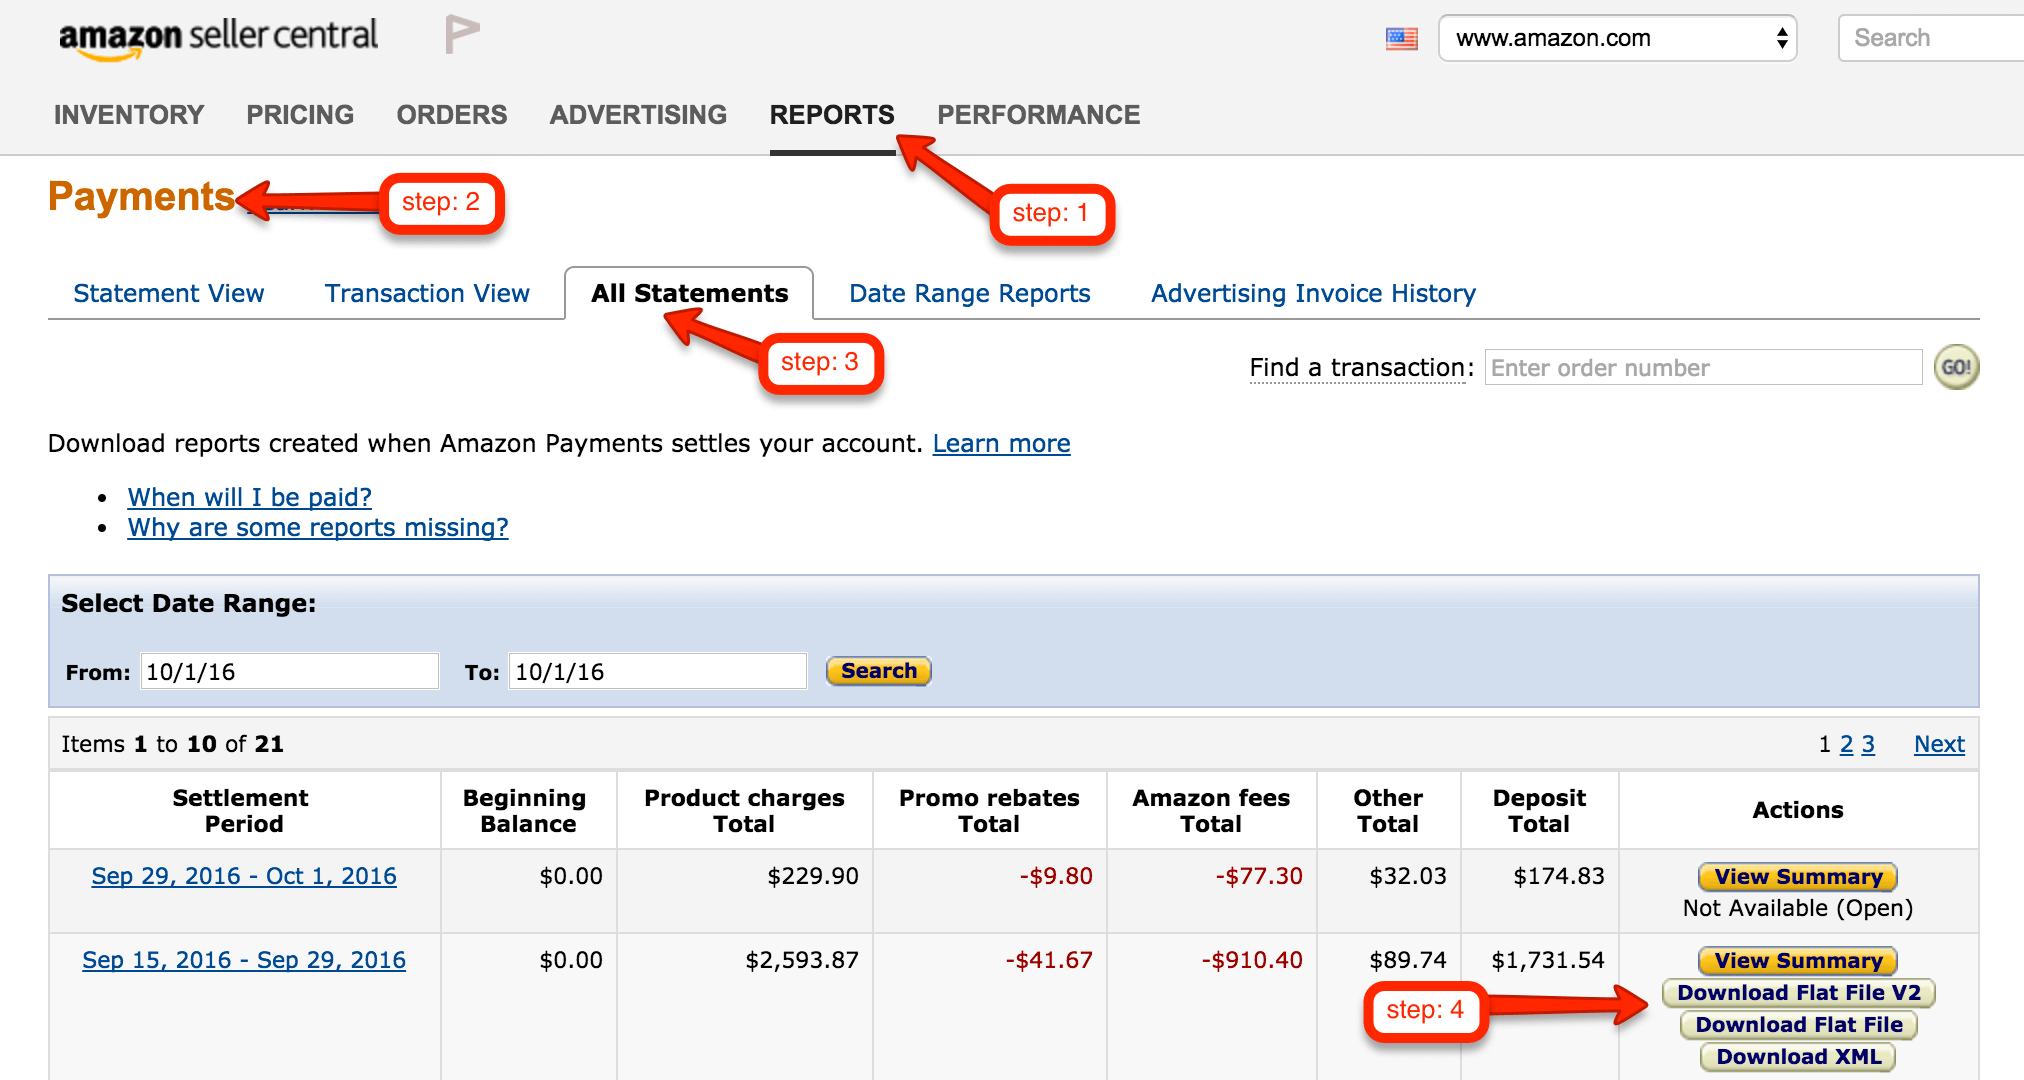
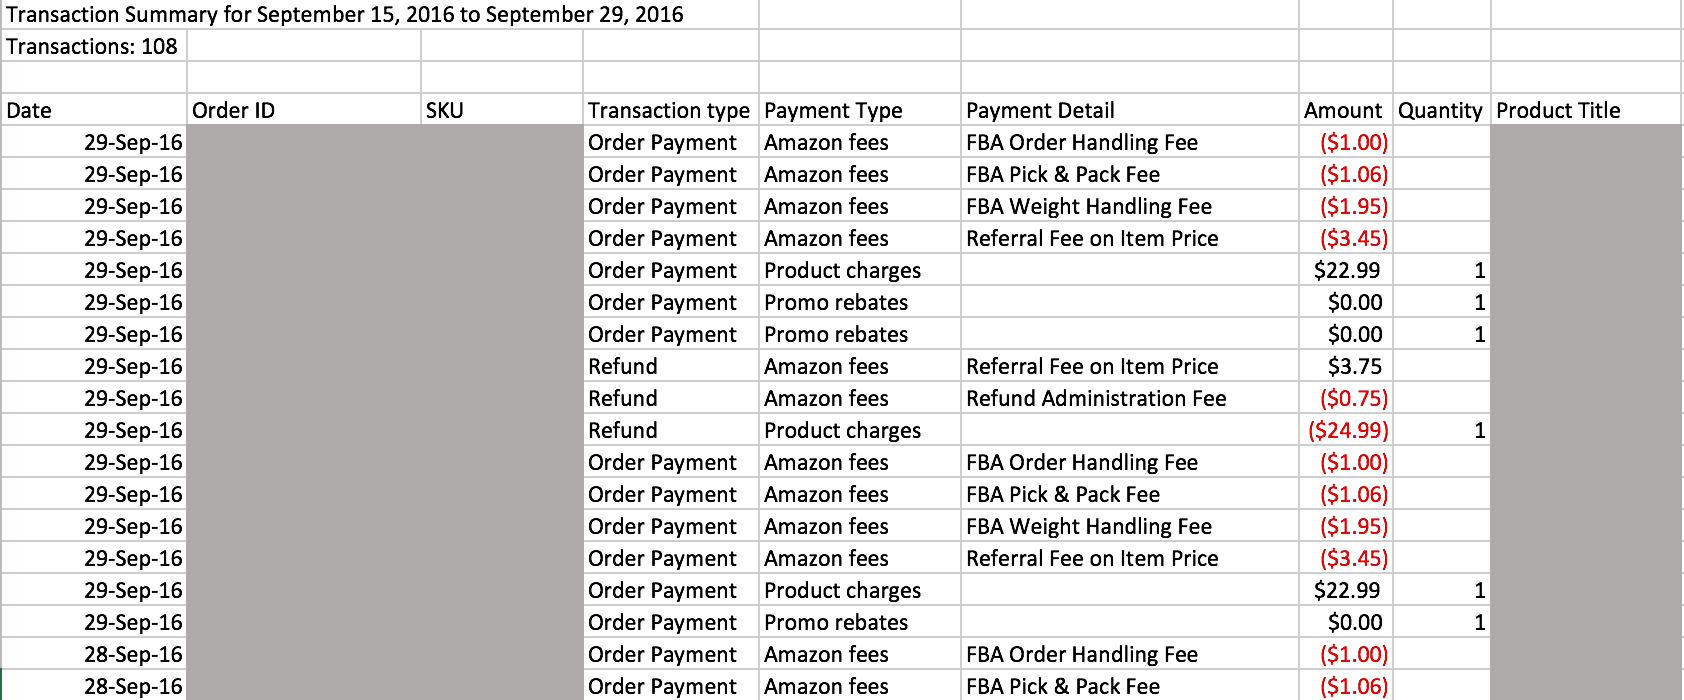
Downloading this file will give us a complete record of every single orders transaction that occurred during the reporting period. Call me overly cautious, but I use this report to quickly confirm that the data in the summary is correct. I like to make sure I am getting paid correctly 🙂 It is also a great place to catch odd transactions that would otherwise go unnoticed.
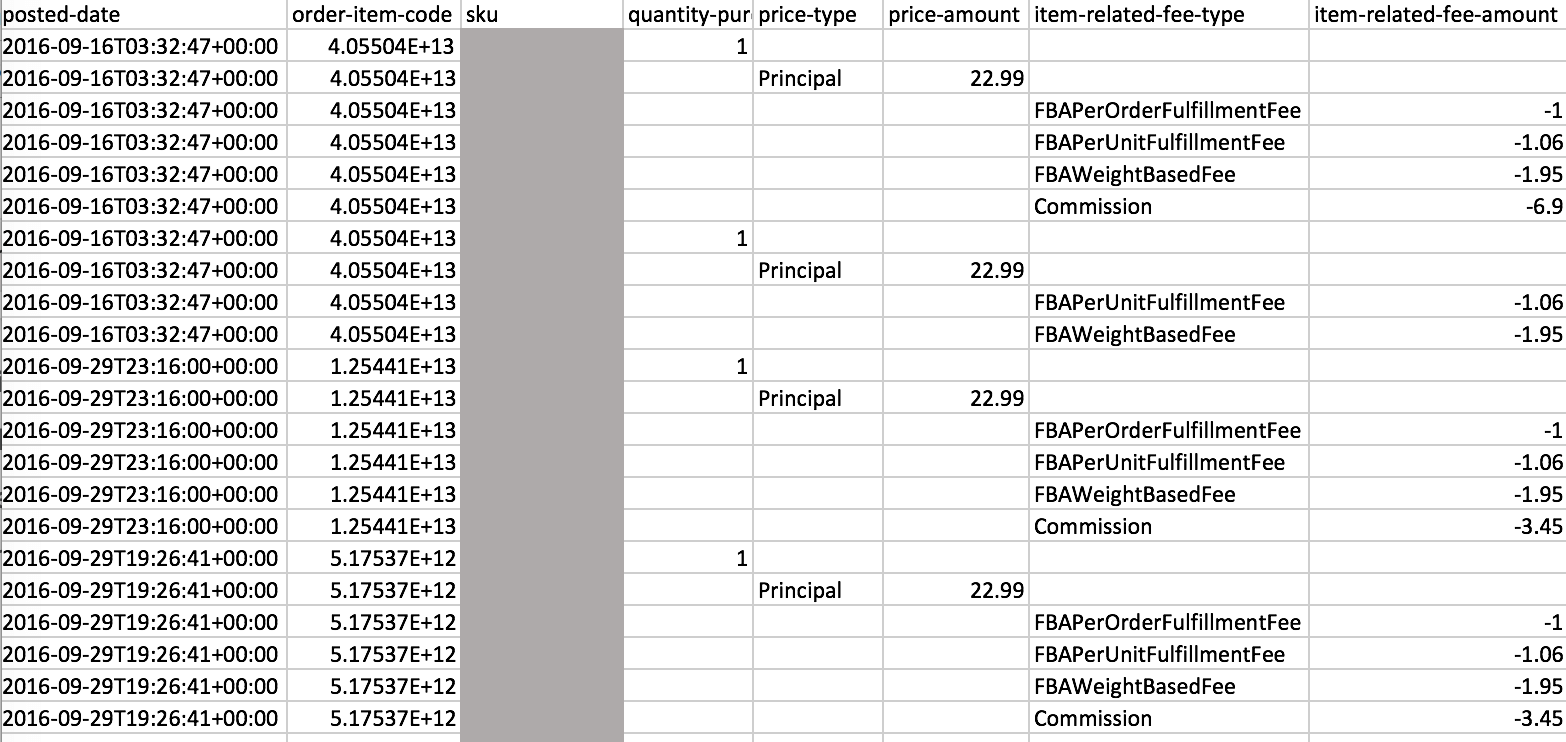
The raw file looks like this. Yuck.
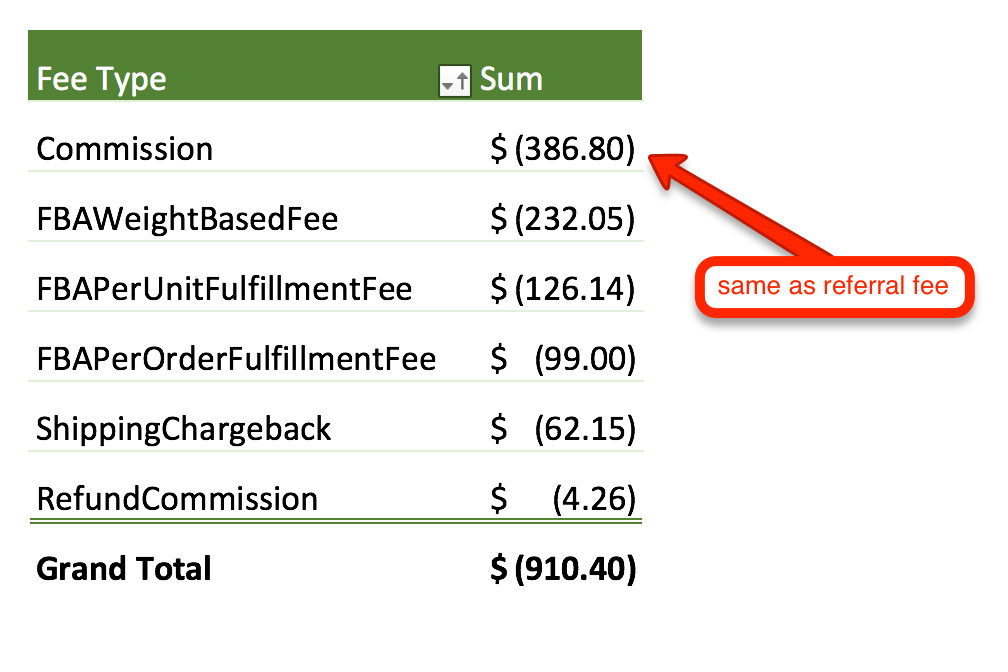
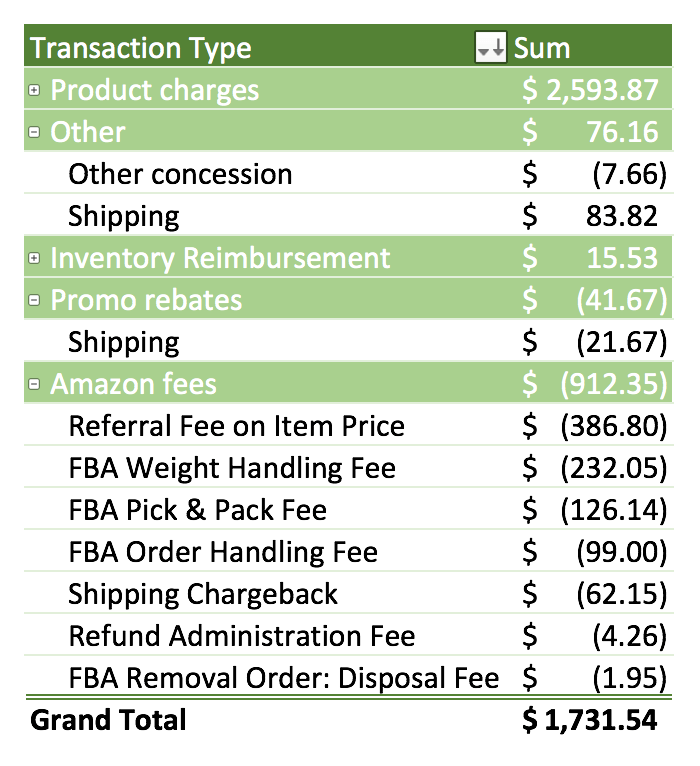
Tidy up the data with a few pivot tables and you get a nice breakdown of fees and revenue.
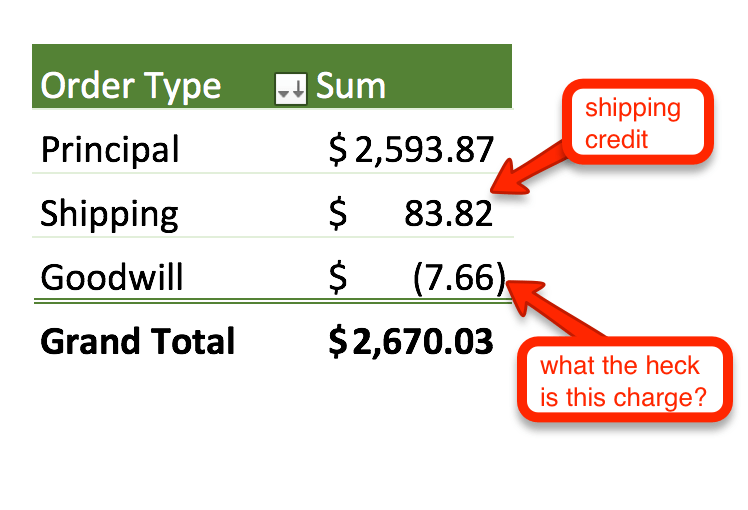
The pivot table catches a strange charge called “Goodwill” for $7.66. It turns out that Amazon probably got an earful from a customer and decided to take responsibility for some mishap. Amazon initially charged me for the activity, but they will credit me back with a miscellaneous adjustment in my next statement. I will keep an eye out for it 🙂
2) Transaction Report
My favorite report can be found here: Reports >> Payments >> Transaction View >> Select Dates >> Download
It offers a cleaner look at every transaction over the selected date range…including promotions! The raw file is pretty hard to work with.
Clean it up into a pivot table and you get a solid breakdown.
This can be a lot of work, but at least we have learned exactly where the money is going and how much Amazon owes me for the reporting period. Are we done with Amazon expenses yet? Nope! Did not see any advertising charges in there?
3) Amazon Pay Per Click Reports
To find your report: Advertising >> Campaign Manager >> See Ad Reports (small button above “Daily Budget”) >> Request Report >> Download
What a beauty…
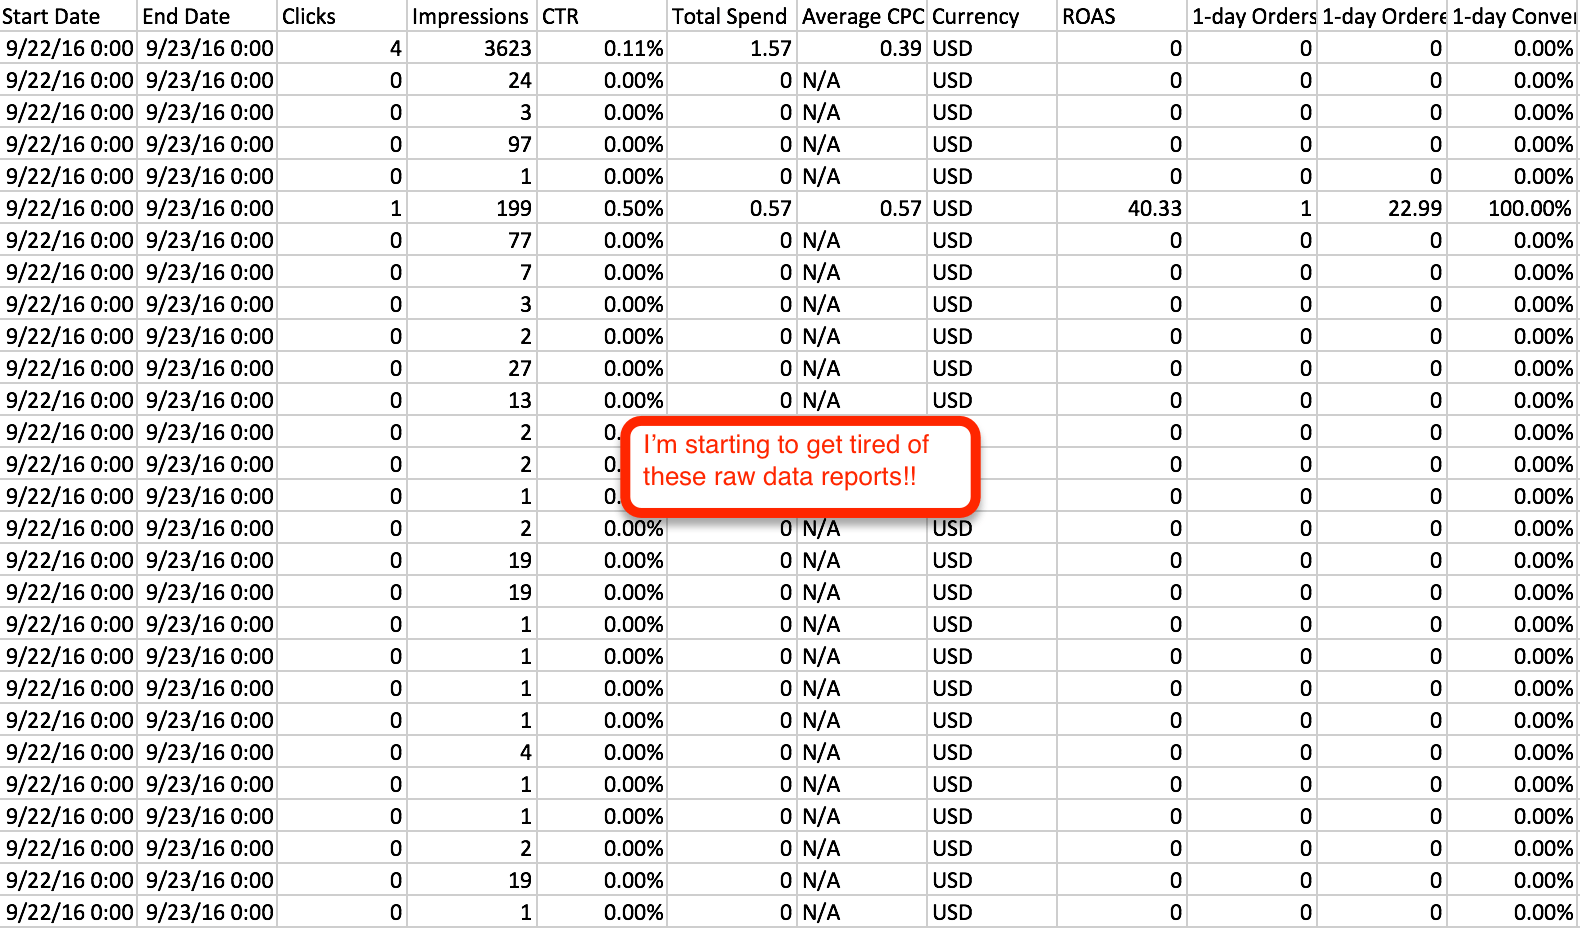
Go go gadget pivot table…
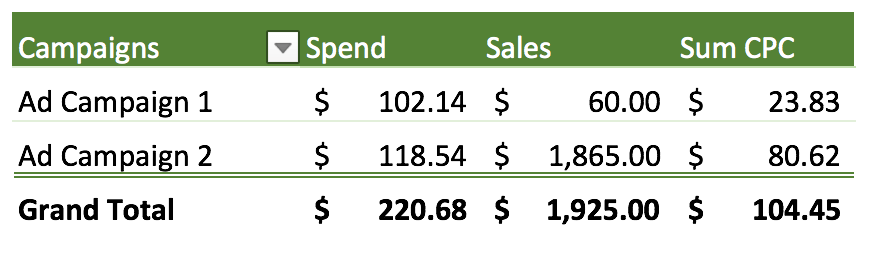
This report covers a bigger date range than we have been studying (one of the challenges with Seller Central), but you get the point. The report is available and it accurately reflects my advertising spend and sales for this lighting product. There is plenty more data in the report that ought to be analyzed regularly. Pay Per Click lovers will want to check this out.
OKAY! We have torn through all of the necessary Seller Central reports to calculate Amazon revenue and Amazon-specific expenses. We have Amazon Fees, Refunds, Promo Rebates,and PPC spend.
But there is still a lot missing from these reports. Amazon does not factor in the costs to manufacture and ship each unit (Cost of Goods Sold). Additionally, they do not know the other overhead costs required to run my business.
To accurately calculate profitability, I will need to parse together all of the data reports we collected, mix in my Cost of Goods Sold, and add any other overhead costs. This is the hard part.
To make things a little easier, I built a fairly sophisticated Profit Calculator. If you would like a copy, please plug in your email address and I will send it right over.
I added my Cost of Goods Sold and other business expenses into the Profit Calculator and let it do the rest.
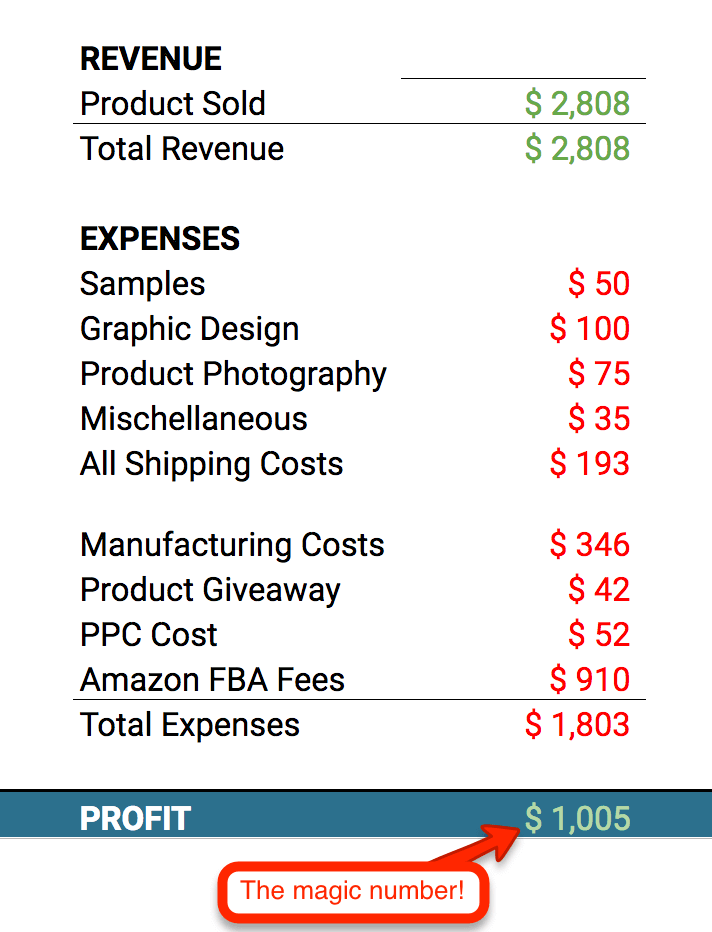
Wow, that was a lot of work! But it feels good to know how profitable this lighting product was over the past two weeks.
The sucky thing is that in two more weeks I will need to download all of the reports again and run fresh calculations.
And what if I wanted to track profitability on a daily basis? What if I wanted to compare this product with my other Amazon products? What if I wanted to compare reporting periods to see my performance over time?
That is exactly why we built Fetcher!
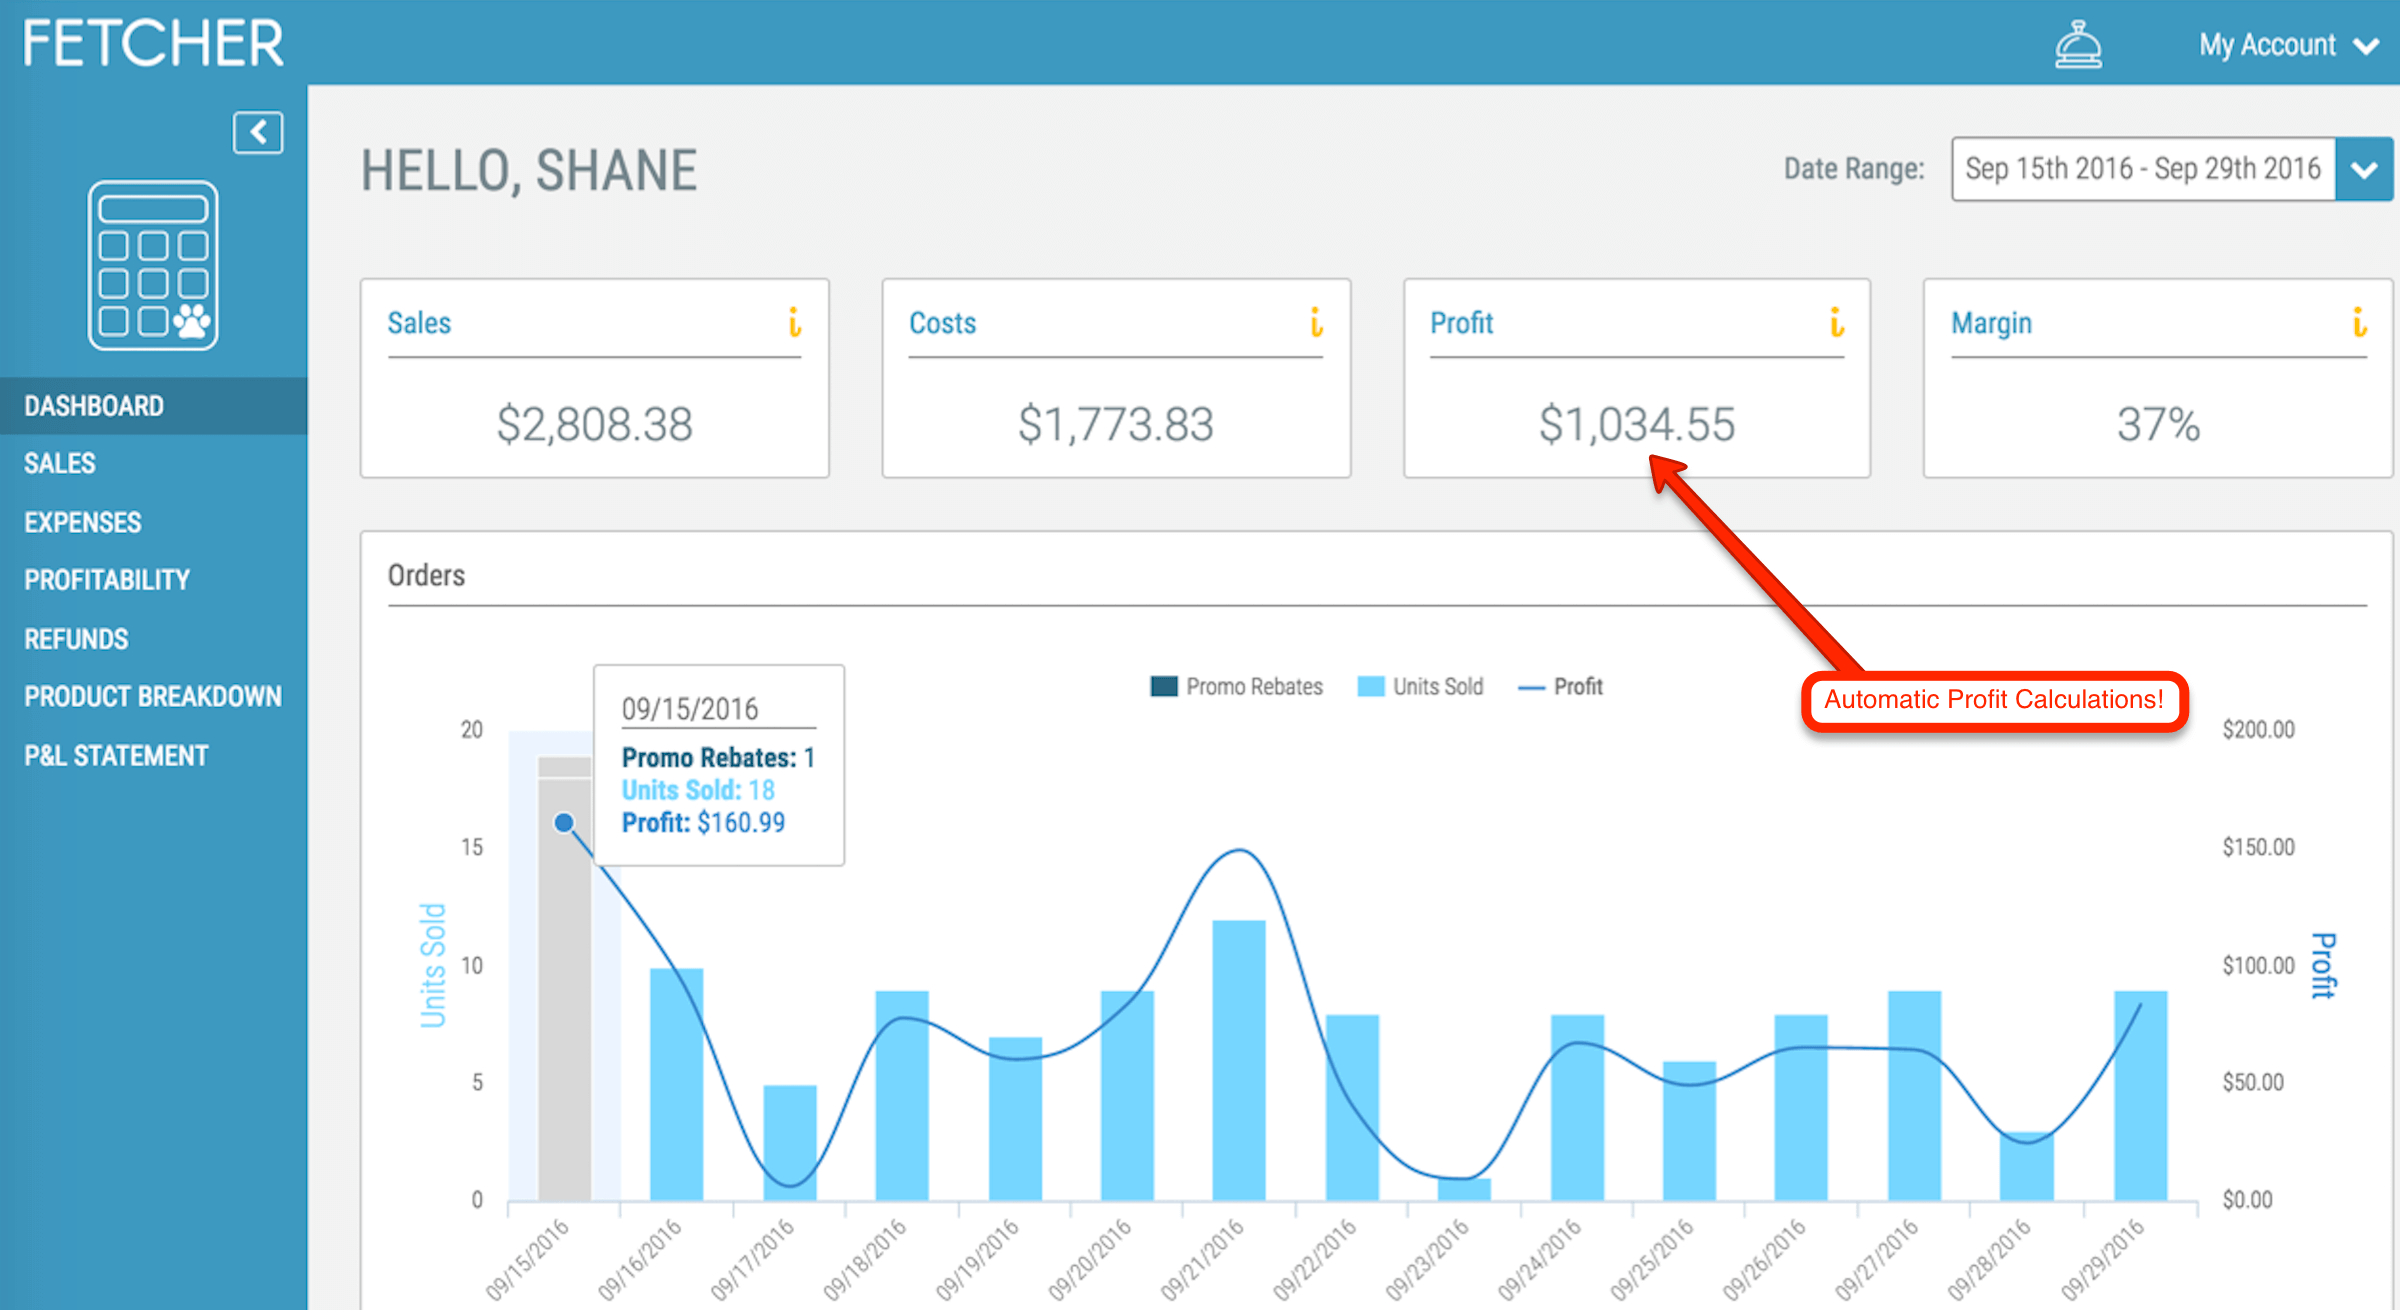
Fetcher's personalized dashboard page offers an instant snapshot of total business sales, expenses, and profit.
The Profit and Loss page provides a clear picture of the overall health of your business and allows you to see performance over time.

Our beta users are loving Fetcher!
“Fetcher is the first thing I look at in morning. The metrics in the Fetcher dashboard show me exactly where I should be focusing my time for the remainder of the day.”
– Brian, San Francisco
“I didn't know my true Amazon profits before I started using Fetcher in beta. I'm making better business decisions as a result of having a new business partner – Fetcher!”
– Catilyn, Omaha
For a free 31 day trial, go to Fetcher.com
Good luck on the road to profitability!
Leave me your questions in the comments section and I will get back to you.