Blog: The Consequences of Poor Amazon Inventory Management
The Consequences of Poor Amazon Inventory Management
Amazon inventory management is the backbone to success as an Amazon seller. You can find the perfect product, create the most badass branding and differentiated product, but….what if you get the dreaded “Currently unavailable” on your listing? You have no products to sell customers, and consequently Amazon drops you like a bad habit. Best Seller Rank plummets, sales flat line, and you check on your shipment status more often than your Facebook feed in the meantime.
I went through an Out Of Stock situation recently with our private label product, Jungle Stix. Perhaps there were ways to avoid the situation, which I wrote about here.
However, Jungle Stix are now back in stock, and selling again! In this post, I want to dig in to the effects of the out of stock situation on current sales. And because our Canada-based developer team has a soft spot for Drake, you may see a few Drake references along the way….because there's just too much fun in a Drake meme. Let's dance!
We Started from the Bottom…
Here’s the situation: we ran out of stock on May 12th. We were out of stock for 26 days, through June 7th. This is a look at how our Best Seller Rank and sales have changed over that time, using the data that I pulled from Jungle Scout's Web App:
![]()
So our Best Seller Rank was #1,742 on May 12th before we ran out of inventory, and we were selling on average 34 units per day for the two weeks prio. How are we doing now? Let’s review a few simple metrics to see how our product was affected by 26 days out of inventory.
On June 7th, we were back in stock! I was so happy, I wanted to give anyone and everyone a big Drizzy-style hug:

There are a few reports that we can look at to see how our current listing may be affected by this out of stock scenario. Let’s dig in and see what the data tells us.
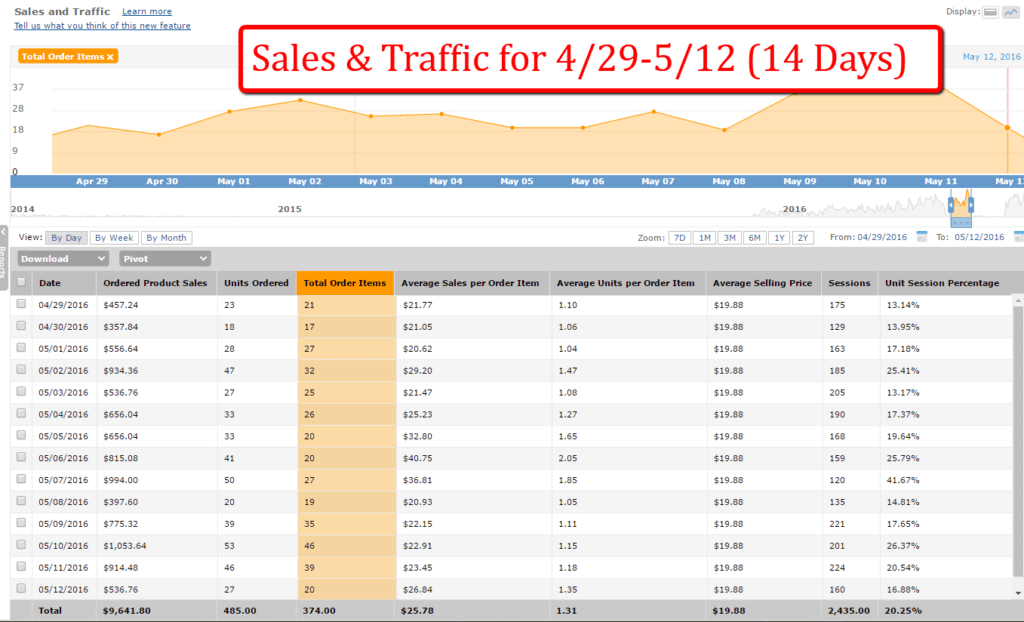
In order to make the most even comparison, I took the most recent 14 days before the out of stock and compared it to the 14 days immediately after inventory was restored. Thus, we are comparing 4/29-5/12 against 6/7-6/20. Here is a look at the data for before the You can see the screenshots from Seller Central here for before the stockout:
And this is the same Seller Central report for after the stockout:
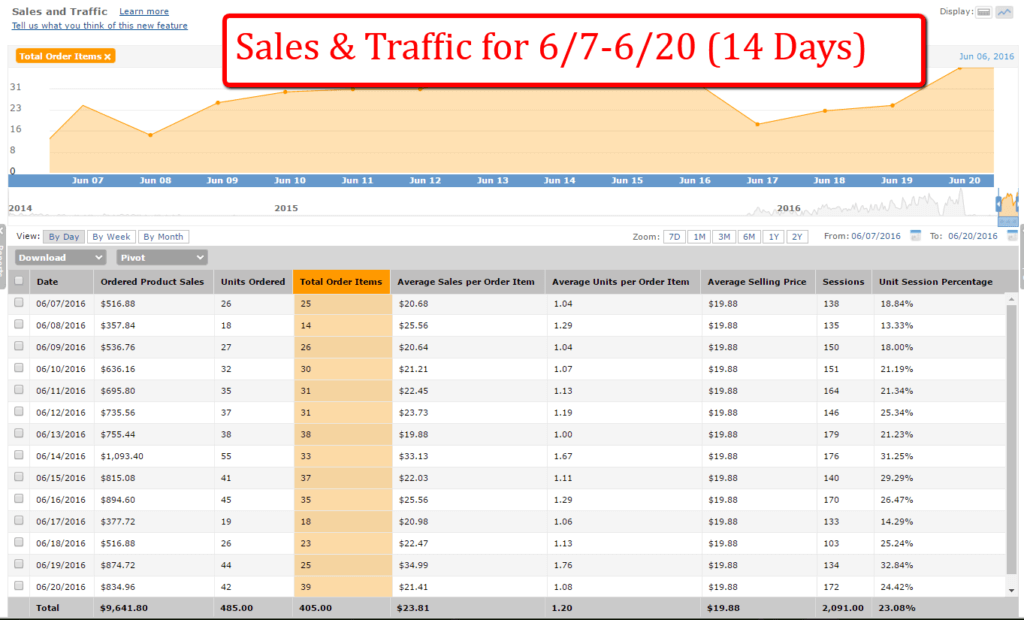
Funny enough, both periods had precisely $9641.80. That is a crazy coincidence! However, in reality, the period from 6/7-6/20 after the stockout includes a period when I was running a discounted promotion on Review Kick*. The Units Ordered and Product Sales appear as if all promotional sales were full-price sales. So the $9641 since being back in stock is actually inflated because we ran about 30 giveaways at $1.99 per unit, as opposed to the $19.88 retail price.
*Note: Update October 2016 – Due to changes in Amazon’s Terms of Service addressing incentivized reviews, utilizing promotions to get honest reviews is no longer allowed. Review Kick has now been relaunched as Jump Send, focusing on email communications to help Amazon sellers grow their business. Find out more information in our relaunch blog post.
Here is a look at the Best Seller Rank since May 12th out of stock (the data is pulled from an excel spreadsheet where I tracked the daily BSR):
![]()
There is an interesting drop in Best Seller Rank on May 21st. Up until that point, our BSR was getting worse and worse, at #27,758 on 5/20. Then it improved to #2,070. I am not exactly sure of the cause for this, however, there was a day or two with one or two units sold. My guess is that these sales were returned products that were still in sellable condition, and each sale reminded Amazon that we are still alive and kicking.
Let’s look more closely at a few key performance indicators (KPI) that can reveal how healthy our listing is after the out of stock.
Average Daily Sessions
Note: “Sessions” is Amazon’s terms for unique visitors. You will also see a “Page Views” metric in Seller Central, which is the total number of hits on our Amazon page. So if one person visits the page three times in a day, the “Sessions” would be 1, and the “Page Views” would be 3. Make sense?
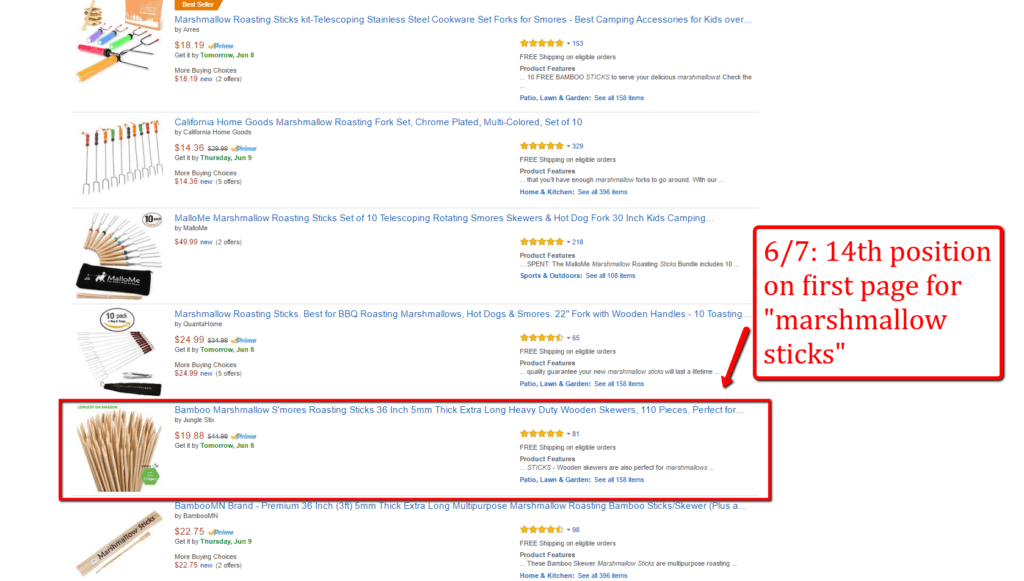
This is a proxy for how our listing is ranking for various keywords. If our listing dropped off of the first page of organic results for our main keywords like “marshmallow sticks”, then we would see a lot fewer Sessions.
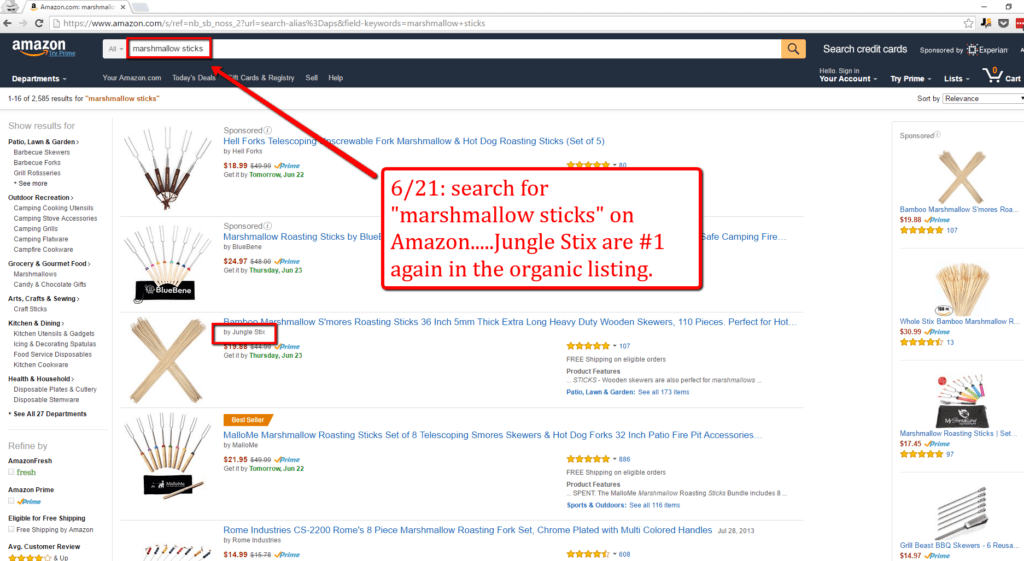
I took a screenshot of where Jungle Stix was for two main keywords on June 7th, 2016. First is the organic results for “marshmallow sticks”:
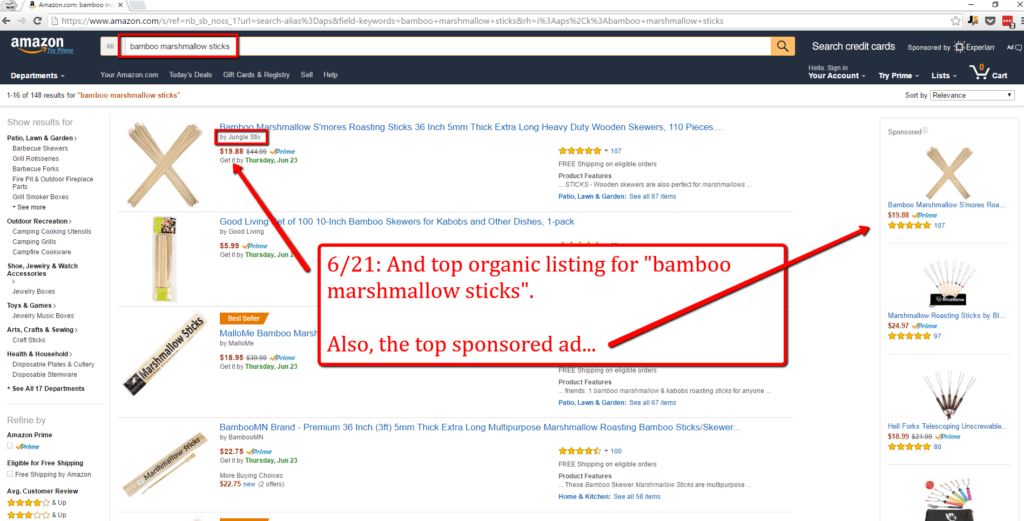
And slightly better, the results for the terms “bamboo marshmallow sticks”:
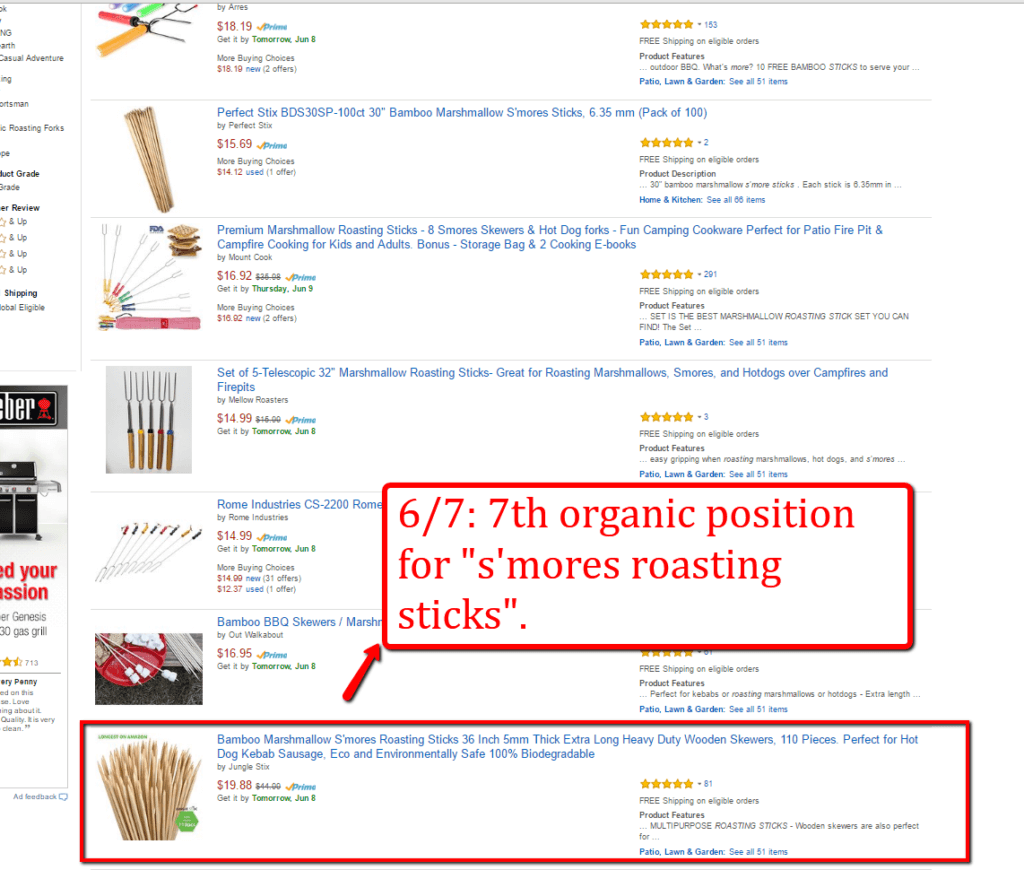
And 14 days later, on 6/21, this is what the organic listings look like for the same main keywords. Starting with “marshmallow sticks”:
And then “bamboo marshmallow sticks”:
So that is great news! We have fully recovered our organic listing since being out of stock. It is hard to pinpoint exactly how much of the recovery is due to our strong performance up until May 12th, and how much can be attributed to the sales velocity and reviews we got from our Review Kick promotions. I think it is actually a moot point though. The takeaway here is that if you do run out of stock, kickstarting your sales with a discount or promotion can help tremendously to speed up the recovery.
Did your daily sessions plummet after #amazon out of stock? check your organic keyword rankings. Click To Tweet
Conversion Rate:
One downside to the Out Of Stock situation is that it gives time for the competition to catch up. In the 26 days that we had an inactive listing, other competitors could be amassing more reviews, optimizing their listing, and improving their conversion rate. This could benefit their organic ranking, if they have done enough to signal to Amazon that visitors to their page are more likely to convert into sales for a given keyword.
The overall daily sessions is a good indicator if we have suffered in organic ranking. However, we should also look at the “Unit Session Percentage”, or the conversion rate of visitor into customer. If our listing has lost its footing and allowed competitors to gain ground, than we may see our conversion rate drop.
However, as you can see from the Seller Central dashboard, our conversion rate actually increased, from 20.25% before the stock out to 23.08% after the stock out. Not bad, almost a 12% increase in conversion rate.
Unit Session Percentage is the far-right column:
There are two large caveats though:
- As I mentioned earlier, Amazon counts the promotional sales as normal sales in Seller Central. So when people redeemed their discount from Review Kick, they went to our Amazon page and purchased as normal, then entered their coupon code. Amazon counts this as a Session and a Sale, but it is not a full price sale and not a visitor who arrived via organic search or sponsored ad. Therefore, the data is slightly skewed.
- We are currently running some split tests on our listing that we were not doing before the stockout. Therefore, it is not a pure apples-to-apples comparison. We don’t know how much of the increase in conversion rate we can attribute to the change in listing, the promotions, or that it is the start of summer and people may be more ready to purchase.
In Conclusion:
Like I mentioned, I knew that I would have to get some giveaway promotions going as soon as we were back in stock. This was a time-sensitive initiative because bamboo marshmallow sticks are hitting peak season right about now, the official start of summer!
The image below shows where I got some momentum from the giveaways. As you can see from the orange bars, we were at 80 reviews during the whole time we were out of stock. From 6/7, we put a significantly discounted product up on Review Kick, and started seeing reviews a few days later. You can see the upward trajectory starting from June 13th, once people received their discounted product and had a chance to test out the product. As of today, 6/21, we have 107 Amazon reviews, overall a 5 rating.
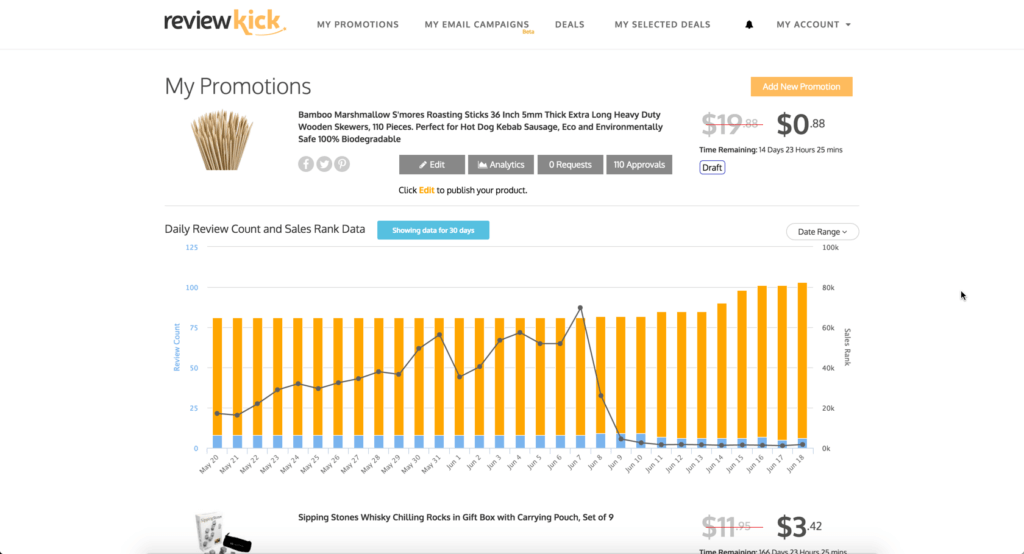
These initial sales, and reviews, are a key component to getting back on track. An indication of this is the line in the chart below, which represents the Best Seller Rank. On June 7th, our Best Seller Rank was #68,992. We started moving units through some organic sales and the Review Kick promotions.
- June 8th, our BSR was #21,512.
- June 9th: #3,783
- June 10th: #2,219
- June 11th: #1,576
- Today, June 21st, our BSR is #1,152:
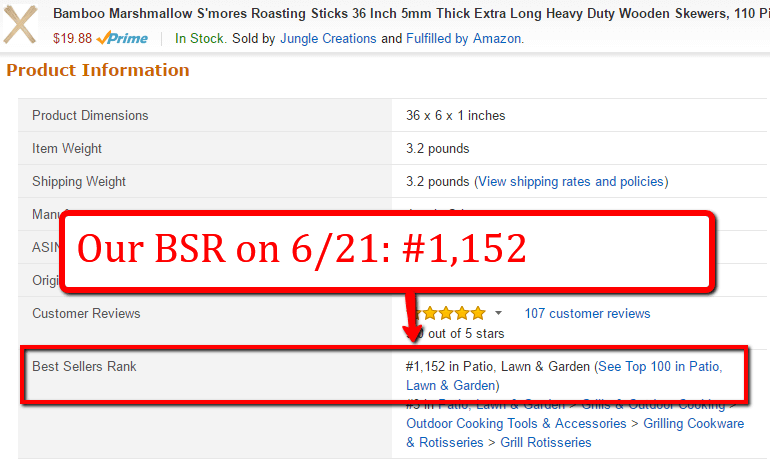
Sell quickly right out of the gate after an #amazon out of stock situation. Your BSR should recover… Click To Tweet
So that's our trajectory, from out of stock to back on top. From what I can see, the negative impact of our stockout was a temporary dip. We have recovered our Best Seller Rank, our organic ranking for main keywords, and our sales velocity. We currently have hundreds in stock, ready to take on these prime summer months!
As you can see, running out of stock sucks. In the future, we're going to be using the help of an inventory management tool called Forecastly to make sure this doesn't happen again. We figure if it just prevents 1 out of stock situation per year, its money well spent!
So pop your champagne, break out your marshmallows, chocolate, and graham crackers, we're about to party like Drake….wishing you the best of luck with a successful and fruitful summer of selling!