Blog: The (Data) Science Behind Jungle Scout's Sales Estimates
The (Data) Science Behind Jungle Scout's Sales Estimates
One of the most common questions we get from users is in regards to the Amazon sales estimates, its methodology, and accuracy. Let me first state the obvious: Amazon keeps its data very close to the vest, so no one outside of Amazon will be privy to actual sales data. With that said, no one takes data more seriously, and collects more data points on Amazon sales, than we do at Jungle Scout.
When I first started building the product, the immediate goal was to save loads of time by extracting relevant information (sales rank, reviews, ratings, etc) that would help me identify profitable products faster. However, I quickly started accumulating and tracking loads of data points that had tremendous value beyond just finding a product. A self-professed data geek, it was a thrill to gather as many relevant data points as possible to sort through and analyze. This data, in aggregate, offered a macro view of sales trends, in each category, on a weekly and monthly basis. This is powerful stuff and can lead to some valuable insights.
Side note: If you want to receive a table of estimated sales for a given Best Seller Rank go here.
Or if you just want a quick estimate for a given category, check out our Sales Estimator (also updated monthly).
Fast forward to today: we follow around 40,000 (and growing) products, spread across all the categories in each the US and UK Amazon stores. We follow all these items on a daily basis and track the sales and Best Seller Rank. At the end of each month, we usually have around 1.2-1.5 million data points for each the US and UK Amazon store, from which we model the relationship between unit sales and Best Seller Rank. From this, we (more precisely, our data scientist) performs regression analyses on the data points gathered. It looks something like this:
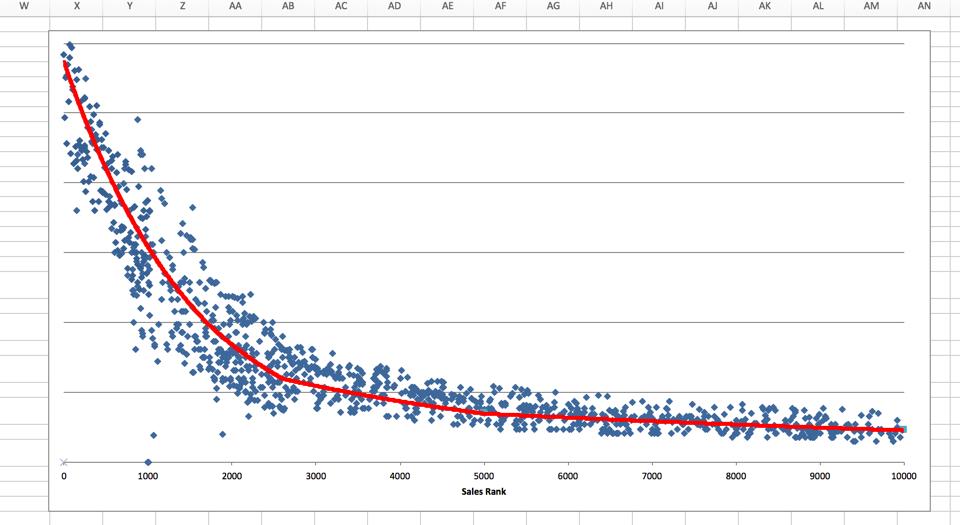
For any given Best Seller Rank, there is a corresponding estimate of sales for the 30 day period.
Lets back up for a second, What’s the Best Sellers Rank (BSR)?
In case you aren’t familiar with the Best Sellers Rank, Amazon gives almost all of the items in their catalog a Best Sellers Rank. The exception to this is a bunch of electronic type items and items that haven’t sold a single unit yet. The lower the numerical value of the rank, the more units it sells in the Amazon store—the goal is to get to #1 BSR, or thereabouts! Each time an item makes a sale, its rank will drop then slowly start to crawl up until it makes another sale.
Items which make lots of sales will have a more consistent sales rank than items that make minimal sales. For example, if my product sells 1 per hour, then I may have a rank of 1000 after a sale, which slowly crawls up to 1100 over the course of an hour but then drops back down to 1000 after another sale. If my item only sells 1 per day, then it may be ranked 50,000 after a sale, slowly crawl up to 65,000 then drop back down to 50,000 after another sale. Because of this, items which sell very few will have a rank that varies greatly. This is the reason that you will see Jungle Scout only estimate “< 5” per month instead of giving you a number lower than this. An item that sells 2 per month could have ranks that vary between 500,000 and 1,500,000 and therefore the accuracy greater than 5 per month cannot be achieved from the sales rank.
We have tested a bunch of different items (e.g. price, seller type, reviews) to see if they factor into the rank and there is minimal evidence of items besides sales factoring into the rank change. I would say at least 90% or more of Amazon’s algorithm to calculate the rank is based off the sales velocity. Because of this, it’s obviously a great indicator of sales.
As you can see, because the algorithm of estimated sales is based on a scatter plot of data, there will be some instances where Jungle Scout estimates vary from the actual sales you may see. That being said, I strongly believe this is the best method for instantly estimating Amazon sales.
Let me address a few items that can throw off our sales estimates and a few other notes regarding the sales estimates.
First, at the current time (this will likely change pretty soon) our sales estimates are for just that snapshot in time. A good way to look at it is to say “If this item continues to sell how it has been recently, it will sell around xxx units per month”. Now, if that item just did a large promo, it won’t likely continue to sell how it has been and therefore our monthly sales estimates for that item will likely be inflated.
Second, sometimes I’ll hear people say something along the lines of “my product really sold 100 units last month and JS estimates it to sell 80/month, therefore I always estimate for items to really sell 20% more than JS estimates.” I would encourage for you to not do this, as you can tell in the above sample graph, JS will slightly underestimate some items and overestimate other items. Just use the JS estimate 😉
Another thing to keep in mind is that the trend lines vary greatly depending on the month and category. Some categories, like Grocery will have a relatively flat trendline (sales do not vary as much with regard to changes in rank) while other categories, like Cell Phone will have a super steep trendline (large difference in sales for a small change in rank), especially in the lower ranks. Because of this, it is very important if you’re estimating sales from rank using the correct category (hint: “Home and Kitchen” is a different category than “Kitchen and Dining”). It’s also a bad idea to try to estimate sales based off a couple numbers your buddy gave you, we’ve collected those times a million for you and we give them out for FREE.
So Greg, how accurate are Jungle Scout’s sales numbers?
Short answer – the most accurate in the industry. Long answer – I’ll need to know what category and range of ranks you’re referring to. The variance changes depending on the month, rank and category. Some months a certain range of ranks will have a very tight grouping of data points while other ranges will have a large variance. Next month, it could completely change.
The sales estimates are plenty accurate for using them for product research and forecasting purposes, keeping in mind that the sales estimates are for a monthly period if the product continues to sell how it has been recently (roughly last day). If you’re trying to use it for a court case where your buddy only paid you for 205 units but you think he sold 208 units, you’re going to need access to their Amazon account for that type of accuracy. Sorry.
We do have a new product coming out soon, where you’ll be able to monitor sales and rank under a magnifying glass to improve accuracy, which we appropriately call the Product Tracker. The accuracy is improved by monitoring your specific products on a daily basis for a set amount of time, as opposed to a snapshot in time.
Woah. That was a lot to take in. The good news is that you can always just hit the JS extension icon in the upper right of your browser and know that the Jungle Scout team will give you the best possible sales estimates in the industry 🙂
Please leave any questions you have in the comments below, looking forward to hearing your comments or feedback!