Blog: Jungle Stix October 2016 Update: On Track To $200k For 2016
Jungle Stix October 2016 Update: On Track To $200k For 2016
Always Be Closing. ABC. It is the beauty of selling on Amazon that you can be closing sales and moving product, regardless of where in the world you are or how you are spending your time.
I have been in Asia for the past few months, and haven't had much time to devote to Jungle Stix, so a product update would be good now. We have been keeping a collection of all previous updates on Jungle Stix on our Collaborative Launch page, which is a great way to catch up on every detail from the past year that lead us to this point.
Jungle Stix has been cruising along nicely so far. October was a strong month for Jungle Stix. Not an all time best, but strong performance with a lot of gas in the tank to continue growth for the foreseeable future. Let's take a look at the specifics.
Oh, a quick note: these screenshots are from Fetcher, a new Profit Analytics app for Amazon sellers that we have just launched. I have been using it every day as it is a much cleaner and more intuitive dashboard than Amazon’s Seller Central digital maze. We have a free 31 day trial, so feel free to give it a spin for yourself at no cost.
Sales Overview
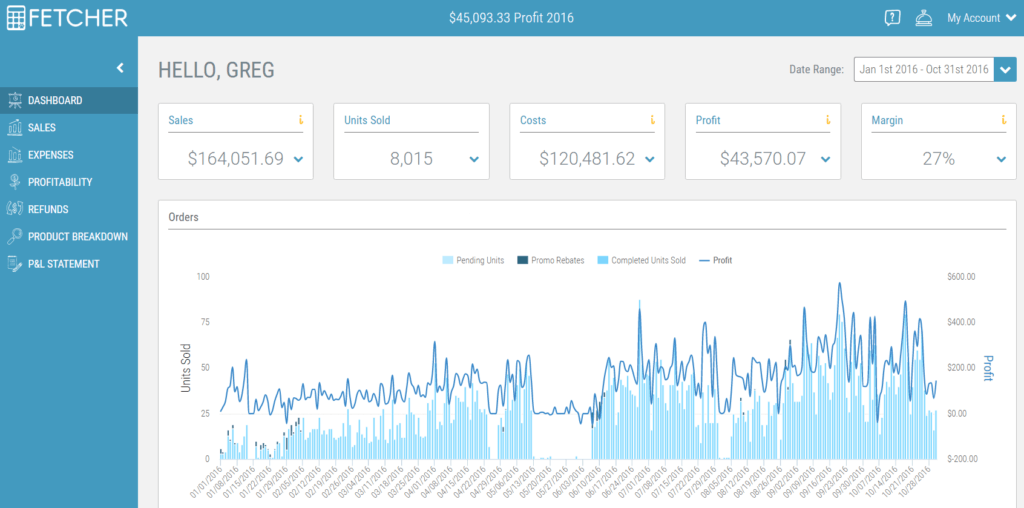
Let’s take a step back and look at how the product has performed Year To Date through October 31st, 2016 with a high-level view of the dashboard:
And a more granular perspective, of the Profit And Loss Statement:

For January 1st 2016 through October 31st, 2016, we have achieved the following:
- $164,051 in sales
- 8,015 units sold
- 27 units sold per day, on average
- $43,570 in profit
- 27% profit margin
And if we break down the metrics for just the last complete month of October 2016:
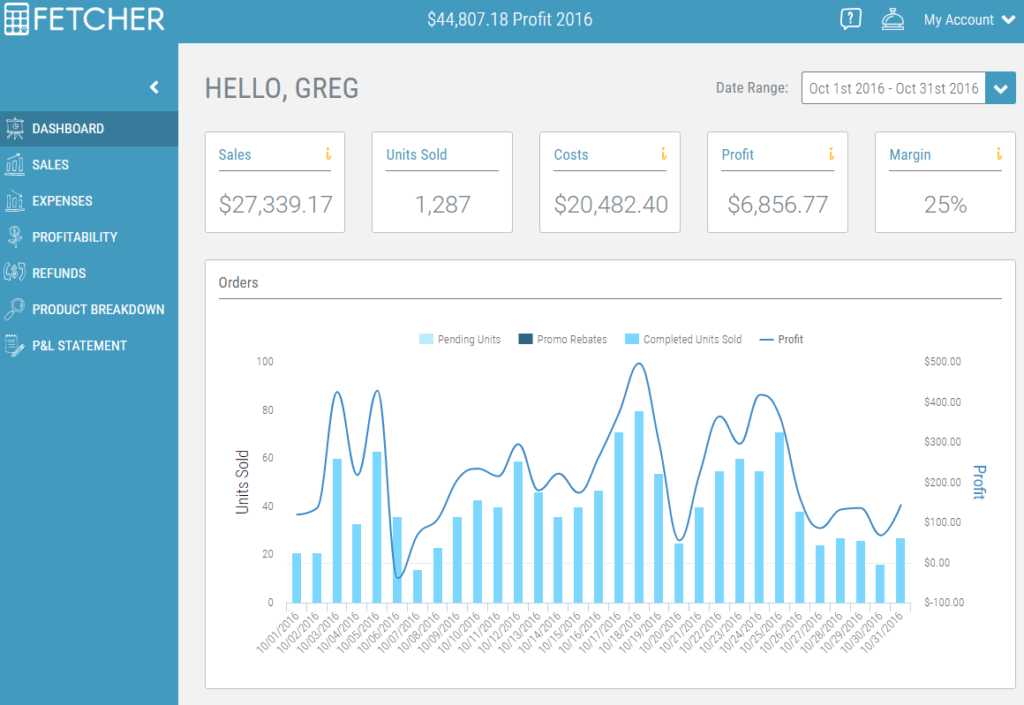
It helps to dig into the top line revenue, and costs to get a better idea of where these figures come from. This is a snapshot of Fetcher's dashboard for 10/1-10/31:
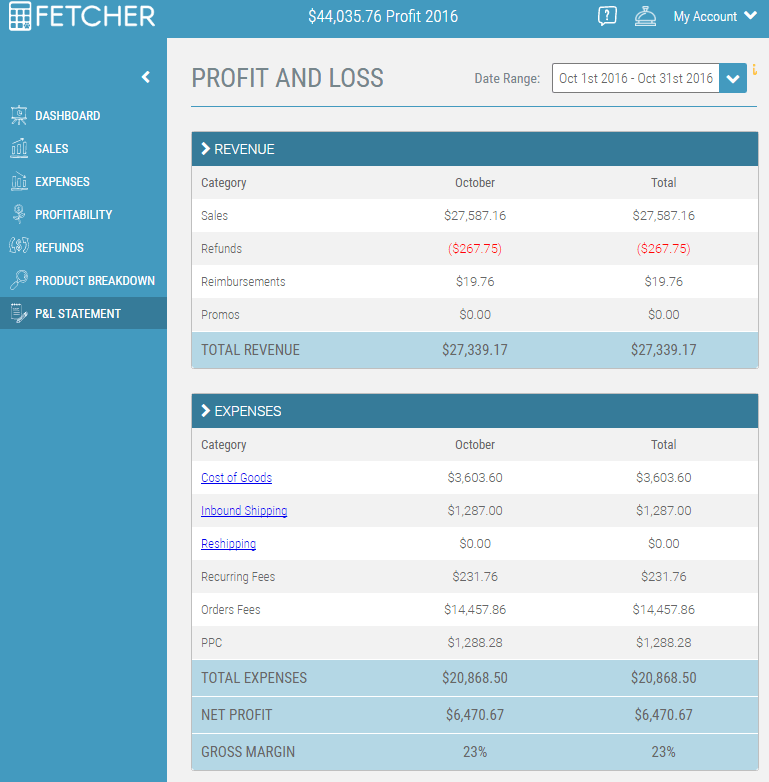
The figure that jumped out to me was the 23% Gross Margin figure. Quite literally, the bottom line. This skewed lower than our Year-to-Date figure of 25%, and lower than the previous month of September. Sometimes it is hard to understand these numbers in isolation, so I like to do a side-by-side comparison. Let's compare September 2016 to October 2016, because we did so well in September.
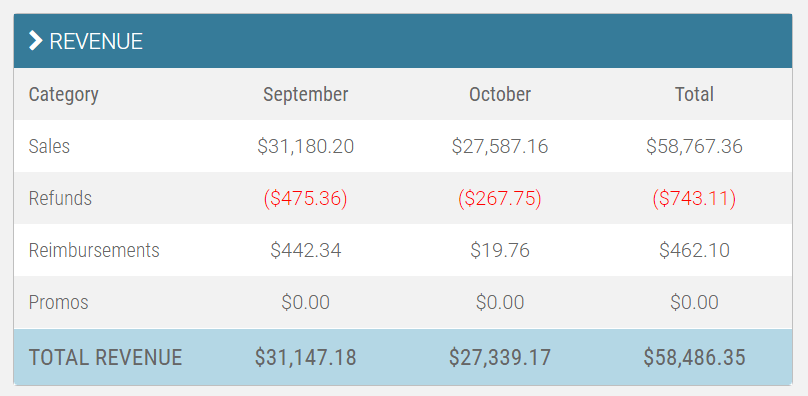
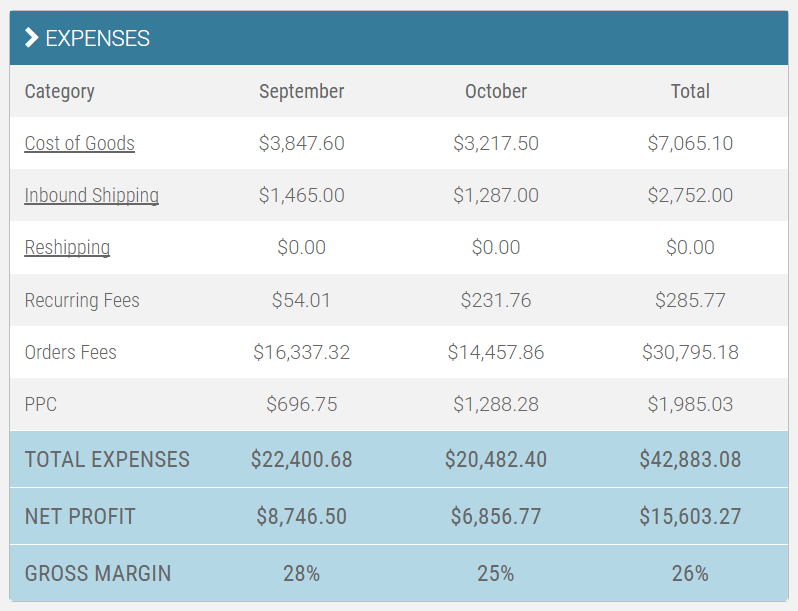
Top line sales dropped about 12% from September to October. Moreover, our expenses as a percentage of sales was higher in October, which is the difference for the decreased Gross Margin.
When digging into my profit analytics, I like to isolate two time periods of interest and do a line-by-line comparison.
I will then ask myself questions like:
- Are there any abnormal figures that appear to be outliers?
- Was there any particular event during either of these months that would effect consumer behavior?
- Are there any concerning figures that warrant a deeper investigation?
- Where can these numbers be improved?
- How can they be improved?
Cutting Down Expenses
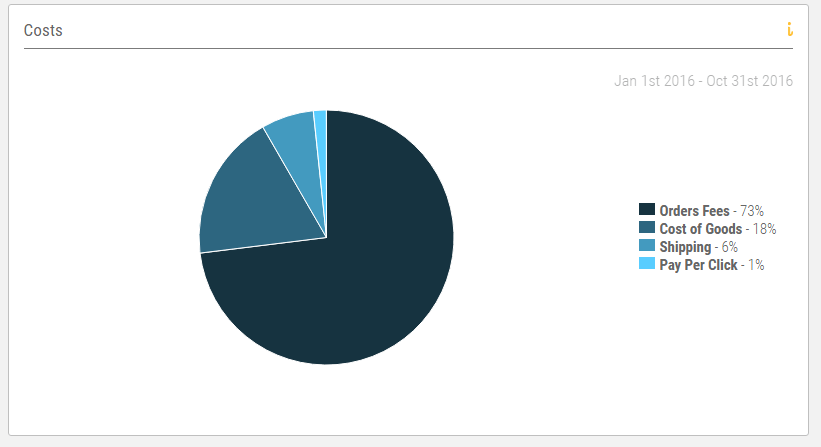
How can we cut down on the expenses to improve gross margin? As you can see above, a bulk of the expenses are “Orders Fees”, which are all of the Amazon fees. It is pretty hard to alter that–our product is the size and weight that it is, no changing that.
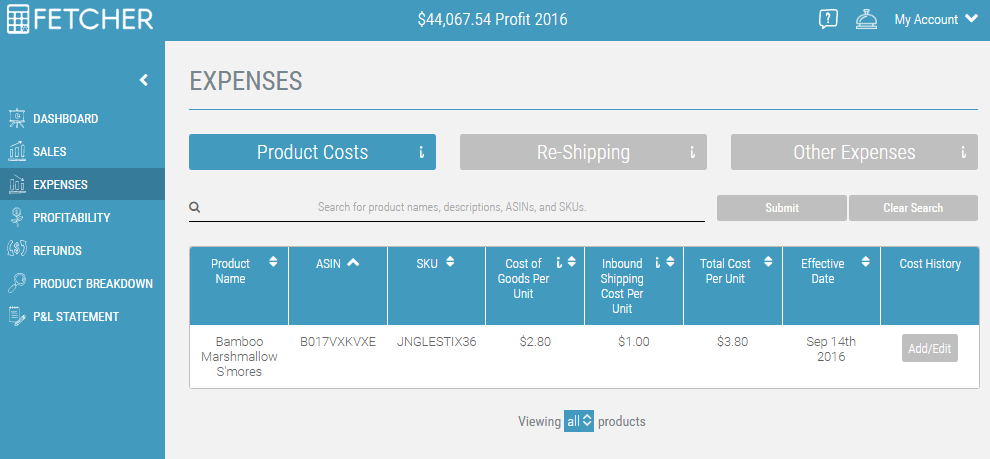
However, I have been trying to improve the Cost of Goods sold by improving the manufacturing and shipping costs. Right now, we are slightly under $4 per unit landed cost. Every penny that I trim with either the Cost of Goods Sold or Inbound Shipping Cost essentially goes to the bottom line.
Every penny you trim off your costs goes straight to your bottom line! #amazonsellers Click To Tweet
This Fetcher breakdown of costs is helpful to visualize how the ‘orders fees' make up a bulk of the total costs:
Key Takeaways
There were several learnings from October which I want to share.
Revenue Down Slightly Month-over-Month from September
We saw a slight drop in overall sales in October, as compared to September. This struck me as slightly surprising. I was expecting that we would see a lift in sales in October with the seasonality of the product.
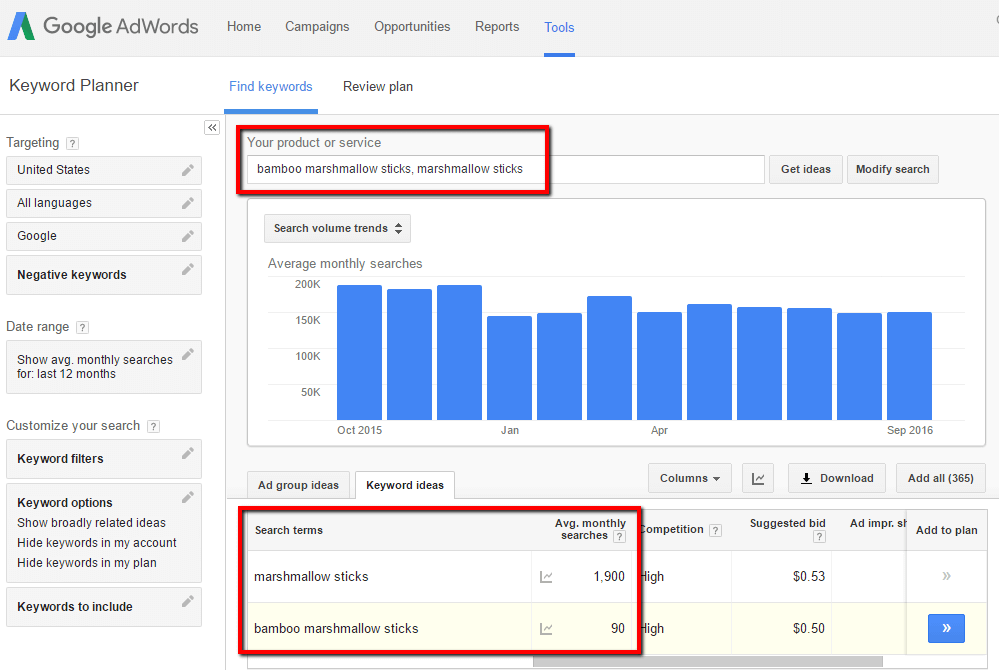
If you look at the Google search volume by month (in Google Adwords Keyword Planner), you can see that there is an increase in searches for “bamboo marshmallow sticks” and “marshmallow sticks” in October vs. September:
It also helps to reference Google Trend data to see some seasonal fluctuations of how people are searching for the keyword. It looks like we should have continued interest through the end of 4Q:
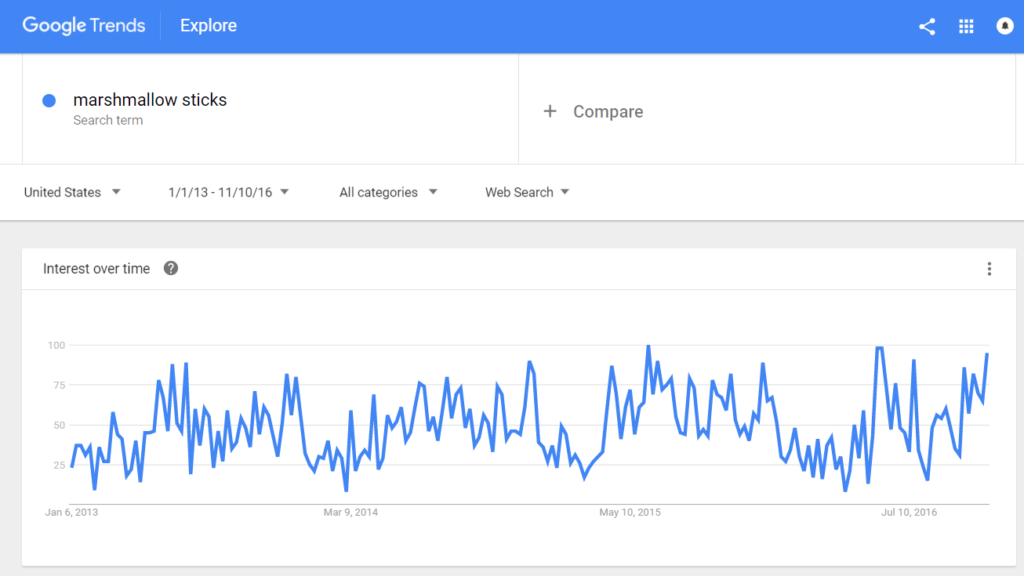
Use Google Keyword Planner and Google Trends to identify search volumes and seasonal fluctuations Click To Tweet
We Lost Reviews – Did not Effect Conversion Rate (Much)
To answer my question above of any atypical events in October, many of you may know that Amazon changed its Terms of Service, disallowing incentivized reviews. This means that no longer could sellers give away discounted products in exchange for product reviews.
There was additional fallout to this change. Namely that some previously acquired product reviews were removed by Amazon. Jungle Stix was effected by this.
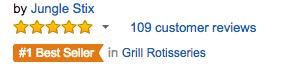
We had nearly 200 product reviews at the beginning of October. Now we have 109 reviews. The number, and rating, of product reviews has a direct influence on conversion rate. Shoppers see social proof in a product that has a lot of strong reviews, and therefore are more willing to purchase those products. So how was our conversion rate effected by our decreased product reviews?
To understand the change, I looked at the conversion rate of any visitor on our page before the Terms of Service change and compared to afterwards.
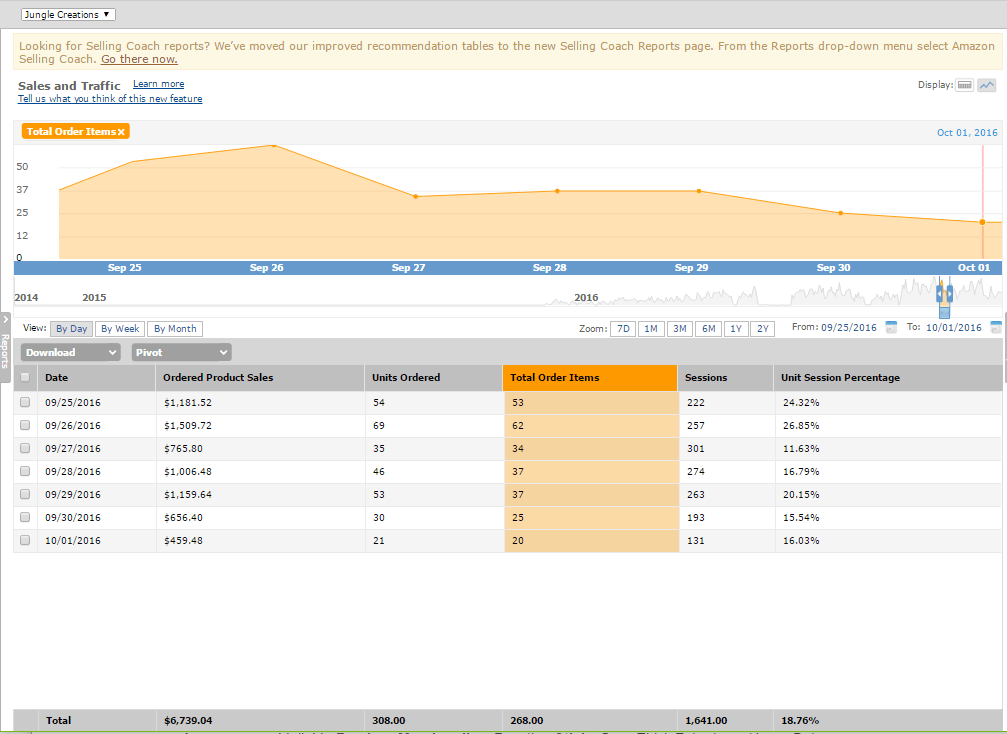
This is a look at the Seller Central Sales & Traffic Reports from Sunday to Saturday, 9/25-10/1. Overall, the conversion rate, called the “Unit Session Percentage”, is 18.76% for this time frame:
And this is the screenshot after the TOS change, from 10/30-11/5. The Conversion rate is slightly lower, at 17.85%:
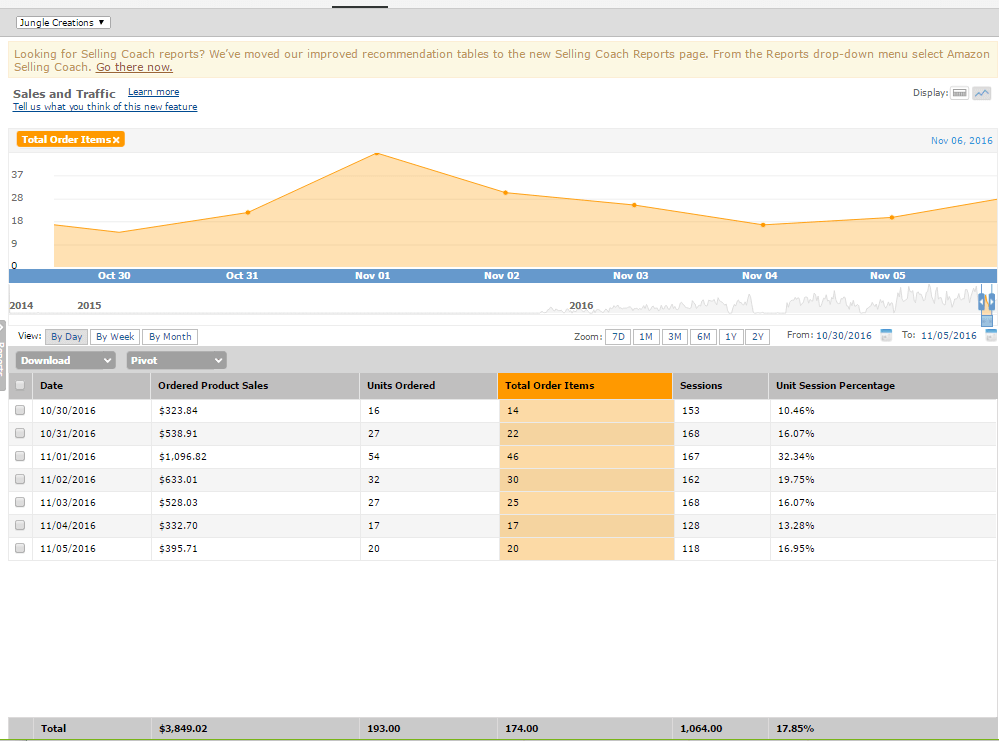
Jungle Stix lost reviews since the Amazon TOC change, but conversion rate was not significantly impacted.
Overall sales are down significantly between these two time periods. $6739 for pre-TOS Change vs. $3849 post-TOS Change. This could be related to any number of reasons (less customer demand, a competitor running a promotion or sale, seasonality, etc). However, we can rest assured with this small sample size that our conversion rate is not significantly impacted by the lost reviews, at this point.
Our Organic Amazon Ranking Improved
The good news is that our organic ranking in the Amazon search results has actually improved. We are now the top result for “marshmallow sticks”, which is a relatively new development:
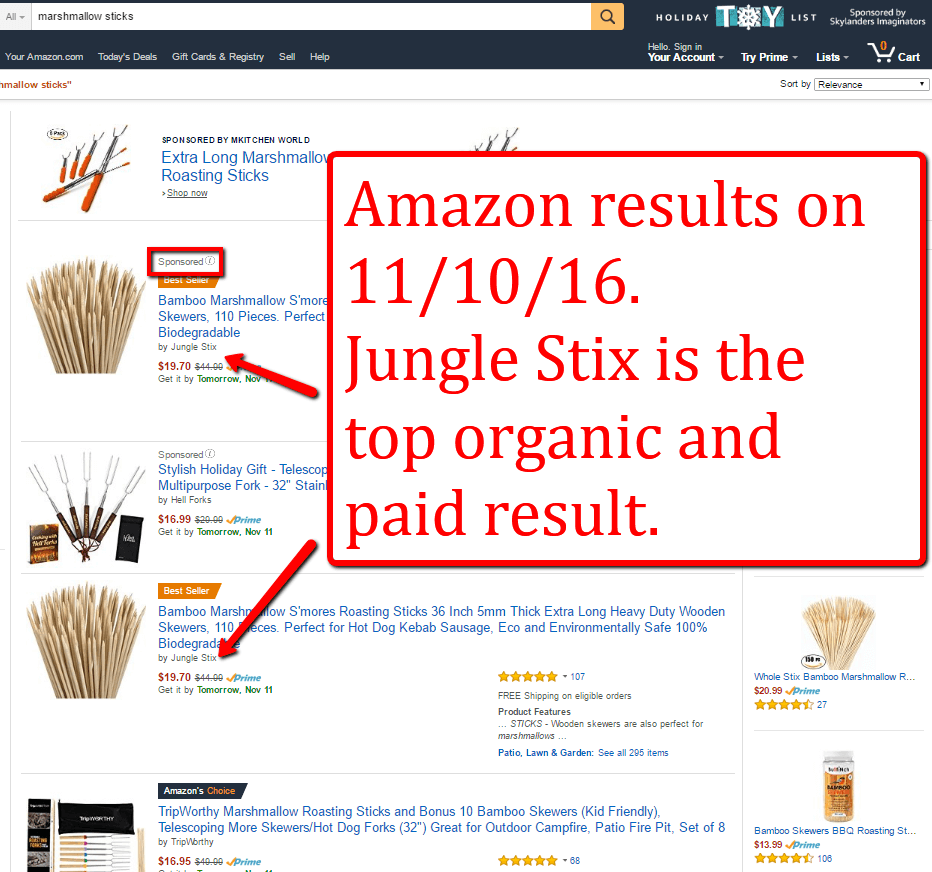
As you can see above, we are still running our Pay Per Click campaigns aggressively for the keywords that are most relevant. With our exact match campaigns, and strong bid, we are the top ranking sponsored product.
Our Organic Ranking in Google Improved
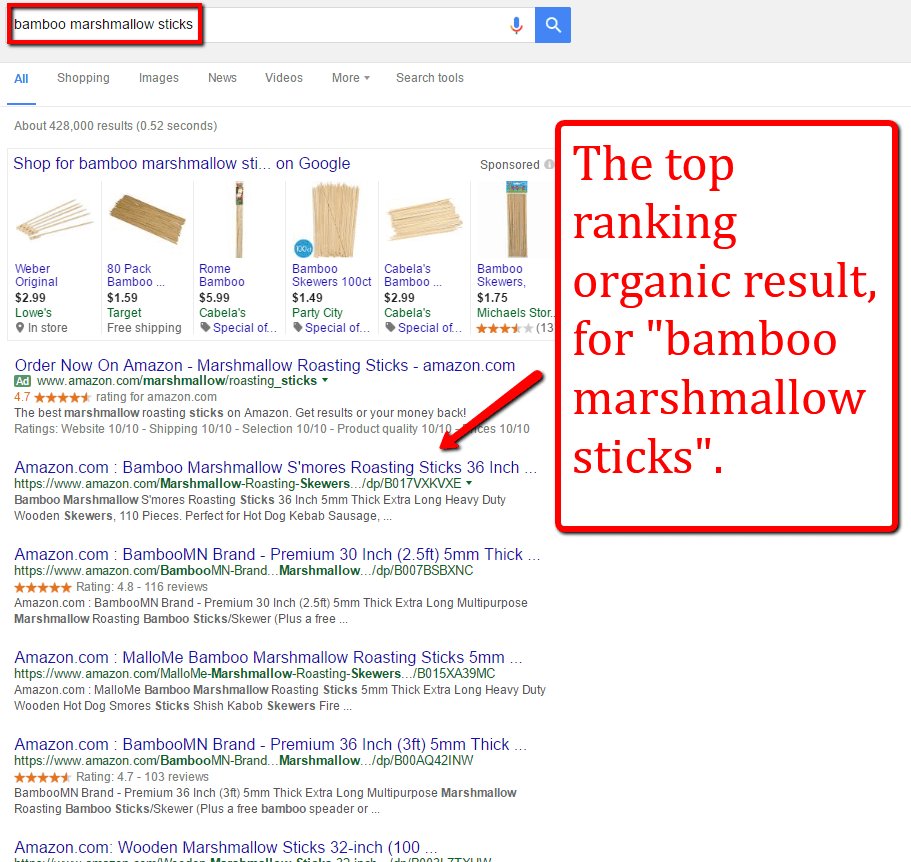
Perhaps even more heartening than the Amazon organic ranking is that we are now ranking in Google's search results! More specifically, we are the top search result for some terms. Here is what it looks like (searched in Incognito so that the results weren’t personalized to my browser history) if you search for “bamboo marshmallow sticks”:
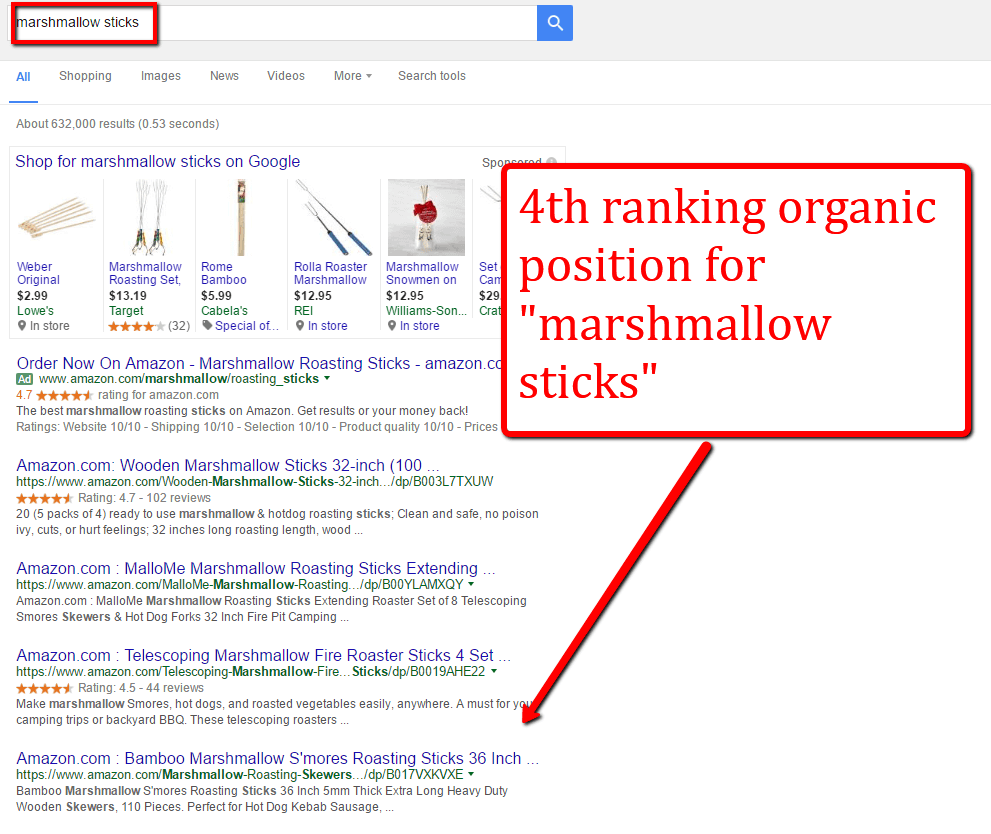
And search results for “marshmallow sticks”:
How Many Sales Come From Google Organic Search?
How much traffic and sales are we getting from this? Well, it is hard to directly attribute any sales to this development in the Google Search Results. However, we can get some rough estimates.
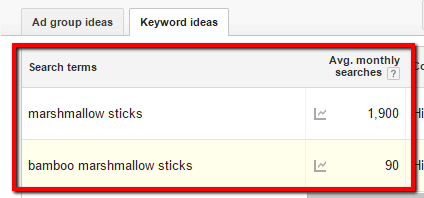
As you could see from search volume data from Google’s Keyword Planner, there are approximately 1900 monthly searches for “marshmallow sticks” and 90 monthly searches for “bamboo marshmallow sticks”:
Moz did a fantastic study a few years ago on average click through rate per organic ranking position. The data looks like this:
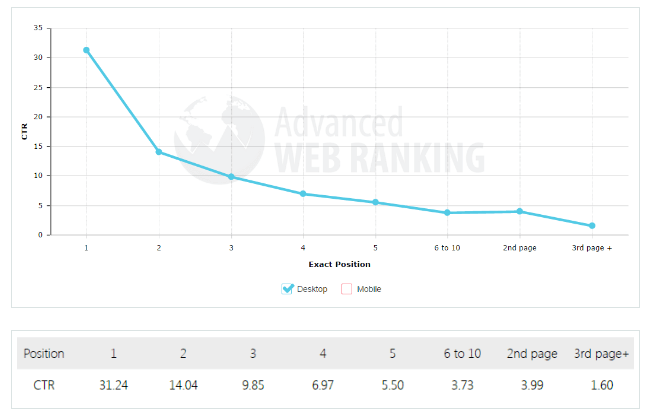
So with “bamboo marshmallow sticks” where we are the top result, with 90 monthly searches, we get 30% of those people—which is 27 people. Then if we take the conversion rate which we know to be roughly 18%, that is about 5 people. So we're getting 5 extra sales a month from ranking in Google.
Apply the same logic for the search term “marshmallow sticks”. Google shows that there are 1900 searches per month, and we are ranking 4th for that term, which has a 7% Click Through Rate. So approximately 133 people land on our Jungle Stix page from Google organic searches of “marshmallow sticks”. Applying the 18% conversion rate from visitor into customer, that is about 24 customers a month. Not bad!
So Google Organic is contributing roughly 29 sales every month from these two search terms. Plus, there are more organic search terms that we are ranking for, including “s mores sticks”, “s mores skewers”, and more. So while we're on the topic, let's get into some of the gritty Search Engine Optimization details of Jungle Stix…
How Did We Get Our Google Organic Ranking?
Using Ahrefs (an SEO back link tool), we can see that there are 16 backlinks from 7 referring domains.
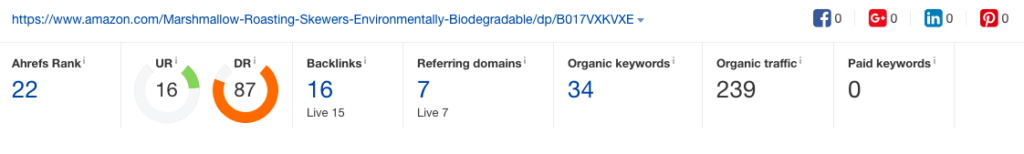
If you look at these backlinks, many are from websites with decent authority (such as Jungle Scout, inspiredinsider.com, thatchicmom.com).
Here are some additional keywords that our Amazon page is ranking for:
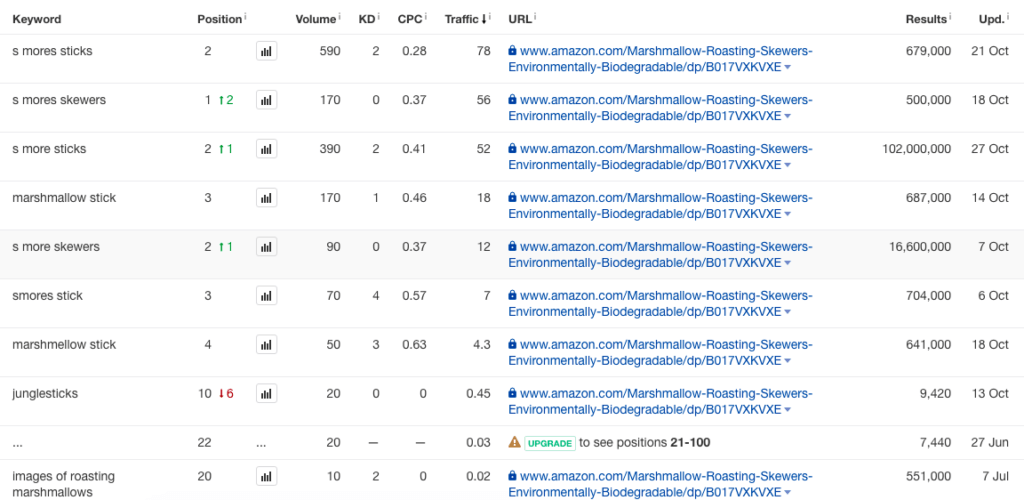
Why is the Jungle Stix Amazon page ranking above other Amazon pages? At a high level, we have more product reviews, more backlinks, and are therefore ranking for more keywords.
Next Steps
So overall, October was a good month for Jungle Stix. On a surface level, we may have endured a bit of a hit with some lost product reviews, but the conversion rate did not decline significantly. We will keep an eye on this and update when we have more data.
I am hoping that we will see month-over-month growth in November and December to finish the year on a strong note. I am also currently running a lot of pricing split tests to see if I can home in on the profit-maximizing price point.
If you plan on enjoying any s'mores, kebabs, or hot dogs for the holidays, jump on some Jungle Stix! And remember, Always Be Closing 🙂