Blog: The Breakdown of Selling Private Label Products On Amazon: Jungle Stix Update
The Breakdown of Selling Private Label Products On Amazon: Jungle Stix Update
Selling private label products on Amazon requires a good bit of flexibility and reactive decision-making, which is where the true fun is found. When I started this collaborative product launch with you guys, I wanted to share every aspect of launching and selling online with full transparency, which I anticipated would include various challenges along the way, with suppliers, importing, competition on Amazon and more. Until now (can you hear me knocking on wood?), we have had good experiences with our supplier, just a few hiccups importing (our products were caught up at US customs for a few days), and now we’re seeing some increased competition with new sellers in the niche. Bring. It. On!
This is a long post and I tried to be as detailed as possible. Take your time to work through the numbers, and tweet at us with any questions. And please share this article too, I know a lot of people want to see the real numbers behind Amazon private label products. Before we go any further, some high level overview:

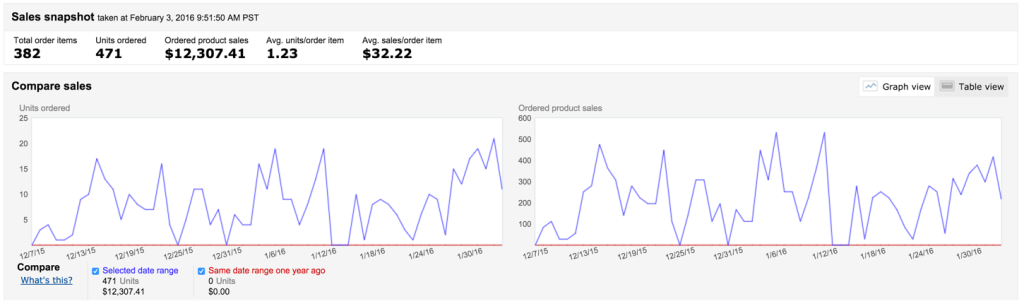
Our product went live on Amazon on December 7th . From that date until today, February 3rd, we have sold 471 units and $12,307 in sales. Not bad! But we of course need to figure out what it cost to achieve this figure in sales. We'll dig in to that further, this is what our unit sales and revenue have been like, per Amazon’s Seller Central Dashboard:
I have gone into more detail on the sales before, but now I wanted to dig in to the expenses of launching a product. People often get starry-eyed seeing a handsome six-figure number for Amazon “sales”, but it’s obviously the Gross Margin (after expenses are accounted for) that is more relevant. My goal for any product that I sell on Amazon is to hit a 100% Return on Investment, meaning that for every dollar I put in, I would expect to receive a dollar coming out.
So let’s first review what the fixed and upfront expenses are. Fixed costs will be anything that does not change, no matter how many units are sold. For a typical business, this would include rent, salaries, insurance, etc. Fortunately, the beauty of Amazon’s business model means that we don’t have many of these costs to deal with! However, we did have upfront costs in order to get the product and listing active. We will not have to pay any of these costs again:
Upfront Costs:
Product Samples from five factories: $350
Label Design: $55
Product Photography: $40 * 6 = $240
Stock Image (image of boy by campfire and graphic of 6 foot tall man): $19
Photoshop work for graphic images: $30
TOTAL UPFRONT COSTS: $694
Note: we did not actually have to pay all of these costs, like the Product Photography, which was donated to us by Robert House. We were in China when receiving samples so actually got all of them for FREE, not even a penny for shipping 🙂 Our in house graphic designer did the design work. That being said, it is more instructive and realistic to include it as a normal expense as opposed to free.
The following expenses are our Variable Costs, or those that change depending on how many units we sell. In a typical business, a variable cost may be hourly wages, material or ingredient costs, fuel for your car, etc. In our case, this variable costs include cost of goods sold, shipping, Amazon fees, etc. For our first 1000 units ordered, they are as follows:
Fixed Costs (for first 1000 units)
Shipping:
$812 for 100 air express (3 days)
$1499 for 200 air cargo 15 days
$1125 for 700 ocean freight all inclusive, fees, customs,
$942 for Inbound Shipping to Amazon Warehouses from Port
TOTAL SHIPPING: $4378
Note – on order 2, our total shipping will be under $2000, we chose to expedite the first order so we could start our case study sooner.
Cost of Goods Sold (COGS):
Bamboo Sticks: $2640 for 1000 (includes polybag and label)
TOTAL COGS: $2640
Promotions and Advertising:
Product Giveaway Cost (50 units): $647
I calculated the “Product Giveaway” cost as $7.92 in Amazon Fees based off $27.99 retail price, plus the $7.02 cost per unit, minus the $1.99 that we “sold” it for on Review Kick. This means we spent $12.95 for each unit we gave away, multiplied by the 50 giveaways. I don't plan to do any more giveaways for the first 1000 units.
This chart shows how our Review Analytics in Review Kick*. You can see that that a majority of our reviews have come from the promotions that I have run on Review Kick, and we have some organic reviews as well (also all 5 star reviews, which makes my heart toasty like a s’more 🙂 ) . I think it’s interesting to see the BSR spike on 1/18/16 as a result of not having any inventory in stock, but you can see a very quick recovery and we are now at a BSR of #1099 in Patio, Lawn & Garden.
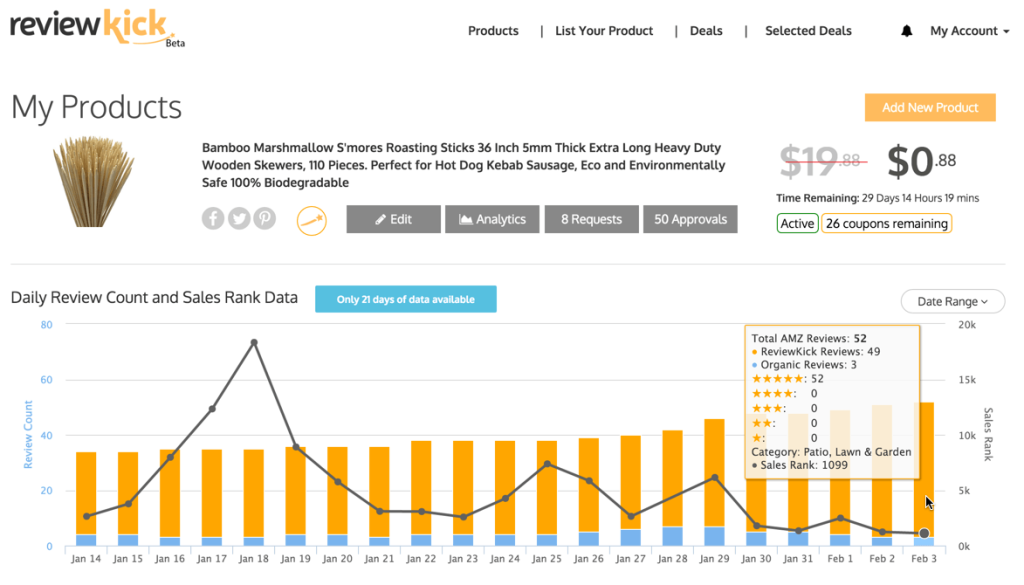
*Update October 2016: Due to changes in Amazon’s Terms of Service addressing incentivized reviews, this method of utilizing promotions to get honest reviews is no longer allowed. Review Kick has now been relaunched as Jump Send, focusing on email communications to help Amazon sellers grow their business. You can still legitimately run promotions, which is a great way to increase sales velocity, but we do not allow any form of incentivized review. Find out more about how Jump Send can help you boost you Amazon business in our relaunch blog post.
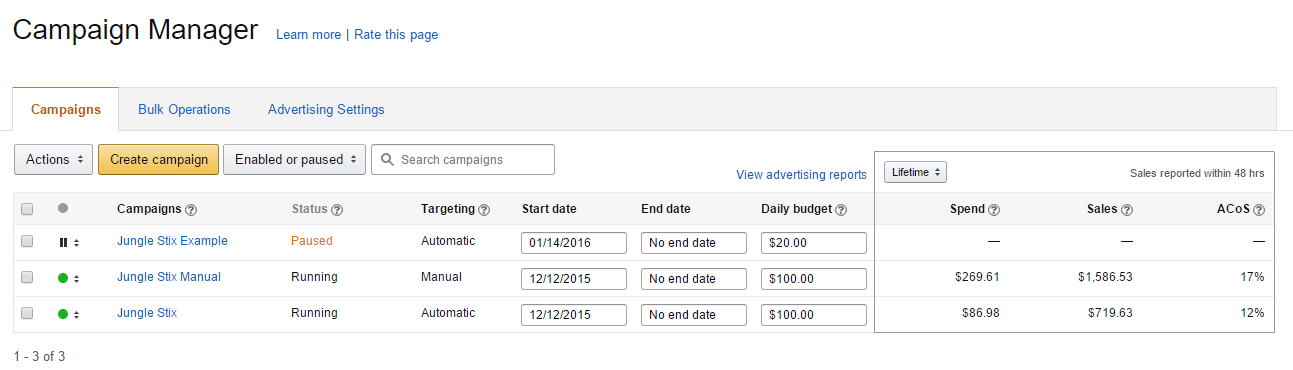
Pay Per Click Campaigns (PPC):
We have spent a total of $357 for our PPC campaigns thus far, and have sold a total of 471 units overall. I will assume that we'll continue to spend at this rate, and I will make sure to adjust keyword bids and campaign budgets accordingly.
Advertising Cost: $357
Amazon FBA Fees:
The cost that we pay to Amazon per unit depends on our final retail price. I am currently experimenting with different price points to find the optimal price that maximizes profits. More on this later. Here is how the FBA fees have looked thus far:
Priced at $27.99, FBA Fees are: $11.12 for 354 units = $3936.48
Priced at $19.99, FBA Fees are: $9.92 for 117 units = $1160.64
Total FBA Fees (for 471 products): $5097
Jungle Stix Revenue
Before we get discouraged with the laundry list of expenses, let's take a look at the revenues. The overall sales are a bit easier to calculate, we can simply take that from Amazon’s Seller Central Dashboard.
For the dates 12/7/15-2/3/16, we have accumulated $12,307 (which you can see in the Seller Central Dashboard screenshot earlier). The sales trends per day are as follows:

Total Revenue for (471 sales): $12,307
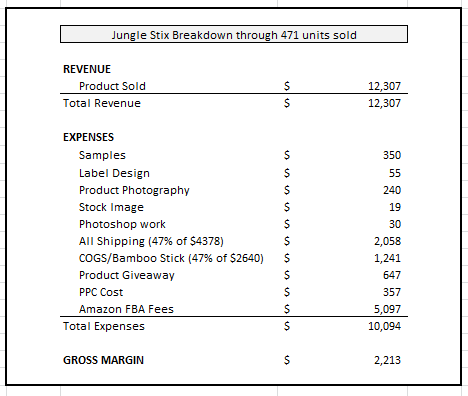
Gross Margin:
Our Gross Margin will simply be the difference between the revenue and expenses. “Net Income” or “Profit” technically include other operating expenses and taxes, which we will not address here. As we are still actively selling, and for simplicity's sake, let's just focus on the gross margin.
What Does This Mean?
We are off to a great start. We've just about recovered all of our initial investment and we still have over 500 units to sell. As I’ve always believed, selling on Amazon is an opportunity that requires a long-term perspective, as I focus on building a real and sustainable business. The gross margin analysis above combines upfront one-time expenses and promotional giveaway expenses (which I don’t plan to incur again) along with variable expenses that will change according to the amount of units that we sell. Additionally, we paid a premium on our shipping for our first 1000 units in order to get the product live more quickly for the purposes of this case study.
Selling on Amazon requires patience and strategy, but starts with a great product Click To Tweet
How does the cost per unit change between the first order of 1000 and the second order of 1000 when we account for the different methods of importing? As a reminder, the first 1000 units were a combination of Air Express (100 units), Air Cargo (200 units), and Ocean Freight (700 units), while the second 1000 units are all Ocean Freight. This is how the costs change between the two shipments:
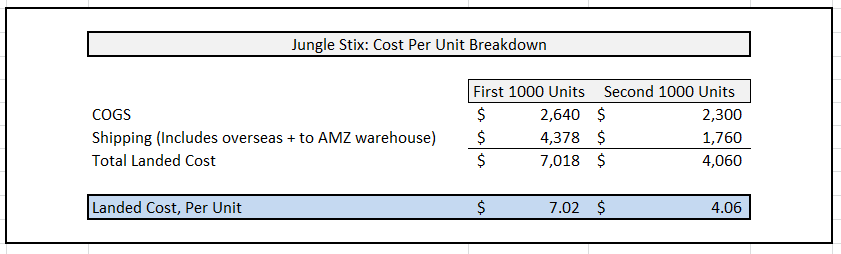
This reduction in cost will have significant ramifications on the profit margins, regardless of where we price the product.
To understand the long-term outlook on this, I like to look at the per-unit breakdown, as our costs are significantly lower for the second 1000 after we incorporate a normalized shipping cost and amortize the upfront investment costs across more units. So the $1341 that we paid to get an optimized listing will now be spread over 2000 (or 3000 units) as opposed to 1000.
The final net margin that we get per unit will be a combination of what the retail price is, and what the associated FBA fees are. This is how it breaks down for various price points, and whether it is the first 1000 or second 1000 shipment:
A note on PPC: In my advertising spend projections, I like to spread the advertising spend in each unit sold, whether advertising contributed to the sale or not. So for example, we have sold 471 units so far, and spent $357 for all advertising. While Amazon attributes $1587 and $719 in sales (per campaign), I think it is easier to note that we have spent $357 in advertising for 471 units sold, or $0.76 per unit. I plan to maintain this spend going forward, and can adjust this figure if conversion rates or CPC costs change.
Regarding Our Pricing:
As I mentioned earlier, we have started to see some new entrants in the “bamboo marshmallow sticks” niche. This was certainly expected, and is the reason most people do not share which products they are selling. If you tell someone exactly what product you're selling and how much money you're making, you're bound to have copy cats.
We have felt the impact of this, and seen our average daily sales decrease. These competitors were selling at $20 per unit, so even though they had fewer reviews, they took potential customers away from us with competitive pricing. We were selling about 8 units per day before these competitors, but that has decreased to ~5-6 per day since. On 1/26 I changed the price to $19.99 to see how that would impact our sales and profits.
Since changing our price to $19.99, we have seen sales nearly triple to ~18 units per day. But how would the new pricing structure change our profit margins? This is what I want to find out….
My goal with experimenting with pricing is to gauge how the units sell at different price points, and what the optimal price is that generates a maximum net margin, and sales velocity. So we have seen that based on current seasonality and competition, we can sell about 8 units per day when priced at $27.99, we can sell 20 per day at $19.99, and if I split the difference at $23.99, let's just assume that we will sell an average 14 per day.
I think that this simple pricing table reveals some interesting data, as we balance the tradeoff between lower-priced and faster selling items, with higher priced and higher margin sales. It looks like the winning combination, in theory, may lie somewhere in the middle at $23.99. Take a look at this table to see what I mean:

Overall Update on Sales:
Overall I think Jungle Stix are certainly a success. On the second shipment, its nice to see that even at the very low price of $19.99, we can still make a profit of $5.23/unit which is a 128% ROI. I imagine the sweet spot for this product is going to end up around $23.99 which would mean 213% ROI (and roughly $3,000-4,000 PROFIT/month).
On another positive note, going in to this, we knew that January through March would be our slow time, and we would see increased momentum as summer and fall approached. So that is good news.
As our Jungle Stix sell more and we gather more reviews, we should see both an increased conversion rate (people more likely to buy a product with many reviews), as well as an improved organic ranking for various keywords (we are currently on the front page for our main targeted keyword, “marshmallow sticks”).
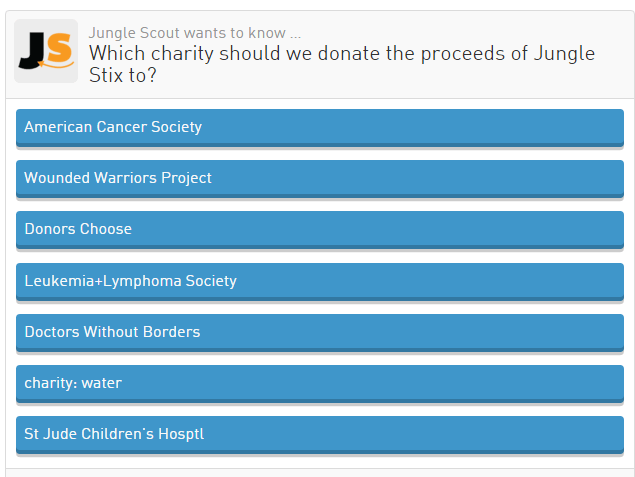
We have not yet chosen the organization that will receive the proceeds, the current running poll is here if you want to send in your vote!
We Ran Out of Product. This Is What Happened.
In early January, we ran out of inventory! This was a result of the ocean freight shipment being held up at customs in Hong Kong for a few days, and delays in the States upon arrival. Argh, not ideal. However, I often see comments online about how this can be a momentum killer and plummet your hard-earned Best Seller Rank. While this may be true, depending on the strength of a listing and competitiveness of category, it is an inevitability at times with only so much you can do.
I did what I could to mitigate any problems: I turned off our paid campaigns and discontinued any promotions. There were three days of flat-lined sales (while we were out of stock) as you can see from the dashboard screenshot, but did it really hurt our BSR? There was a spike in BSR while the product was out of stock (and Amazon automatically removed the product from search results), but you can see from the chart below that the BSR eventually recovered within a few days:
![]()
Next Steps
We have ordered another 1000 units, which will be manufactured and shipped via ocean freight. I would like to exceed our baseline goal of 10 units per day, and see if we can push that up to 20 per day, as we have been doing while priced at $19.99. And I will keep an eye on the competition to see how they price as we move towards the summer months. As I’ve mentioned before, I am not keen on selling products on Amazon that become a race-to-the-bottom—there are never any winners in that situation! So stay tuned to see how this plays out, and please share any comments in the section below, or tweet @junglescout so we can have a dialogue in the twittersphere!